


Gold - Is .0006th Of An Oz Of Significant Enough To Call The Bottom?
Commodities / Gold and Silver 2017 Apr 08, 2017 - 02:45 PM GMTBy: Michael_Noonan

 Yes.
Yes.
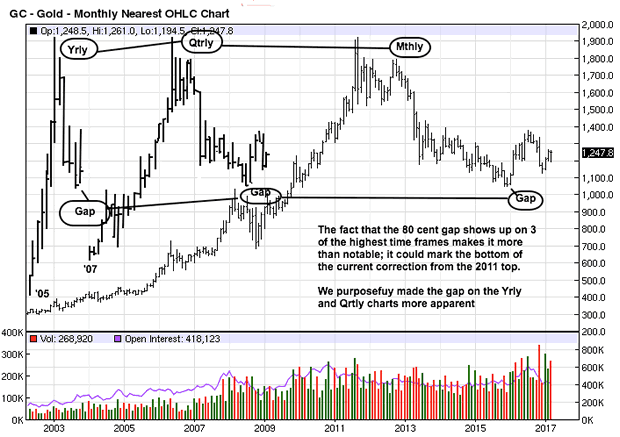
.0006th of an ounce of gold = 80 cents, at $1250 the oz. How can 80 cents be significant relative to gold at that price? It is a tiny gap in price that was never filled. The probability of December 2015 being the end of the downside correction since the 2011 highs grows with each passing week/month. As our regular readers know, our focus is solely on developing market activity as determined by price and volume over time. We pay attention to what the market is saying about its participants and not what others are saying about the market.
There Are No Accidents:
The close at the end of December 2015 was 1060.20. The open for January 2016 was 1061.5 with a low of 1061, leaving a gap of 80 cents that has never been filled. [We use monthly continuation charts]. When looking at the higher time frame charts, the gap is so small that it does not appear as one, which is how we missed it, visually. We noticed it this week while doing a review of charts, and when we put the cursor on the annual, monthly, weekly charts, the December 2015 close of 1060.20 was clear, as was the January 2016 low at 1061, even though it did not appear as a gap when looking at the charts.
We are ardent believers in the expression, "There are no accidents," that everything happens for a reason. A paltry 80 cent gap could have easily been filled by sellers in order to close the Dec '15/Jan '16 gap, yet for some reason, the market manipulators failed to do so. What an oversight, and now in hindsight it becomes a huge market "tell," [an unconscious action that is thought to betray an attempted deception].
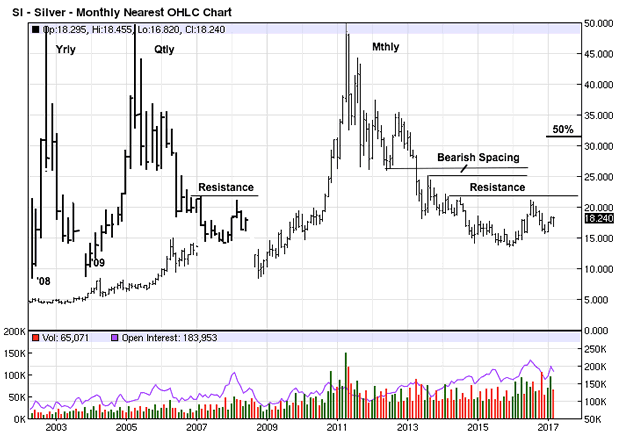
What a gap suggests is buyers, in this case of an upside gap, are willing to "pay up" at the higher gap price without waiting to see of the gap will be filled. Buyers are willing to pay up because they believe price will be going higher. We have explained this circumstance several time when discussing Bullish/Bearish Spacing. [See Silver Mthly chart]
The importance of this 80 cent gap cannot be overstated. We missed it shortly after it occurred, ["there are no accidents"], but even over a year later, its potential meaning is not too late to have meaning as an important message from the market. This is true because the market has pretty much been in a sideways [to slightly higher] trading range [TR]. Price is still closer to the lows than the highs, and still not even close to overcoming a 50% retracement. Plus, buy and hold in paper futures over the past few years has not been a viable strategy in a down market, and not even in a TR.
This tiny gap looms large because it can be the basis for viewing large set-backs as buying opportunities for those trading paper futures. It has little to no meaning for those buying and holding physical gold [and silver], because the purpose for buying physical is totally different. The buying of physical PM is primarily a wealth preservation tactic. Paper futures are purely speculative, although somewhat less so in a clearly defined trending market where the odds of successful trading increase sufficiently when defined by developing market activity. We do not see the paper futures markets at that point, yet.
We have been waiting for confirmation of an up trending market in the form of a higher swing high after the current swing low. Knowledge of the paltry, but now important, 80 cent gap allows for a more assertive view in buying breaks without having to wait for a higher swing high when a turning point can be located after a correction.
As an aside, before discussing the markets, the recent interview with Rory from the Daily Coin has been posted.
In the March 11, 2017 article, Insanity Still Rules: Bullish For Gold And Silver, we said we were giving Trump a pass for now, the benefit of the doubt, but since, we have become concerned that he has hired too many Goldman Sachs globalists in high cabinet positions, not that he had any choice, but Tillerson's comment the other day about Russia's aggression in Ukraine clearly goes against Trump's intent to be more open with Putin and Russia. It looks more and more like Trump will become the fawning puppet Barack Obama became to the globalists as Obama threw his campaign promises and the American public under the globalist bus, once he took office.
Also disturbing is Trump's willingness to support the militarization of the police state in this country, [also discussed in the interview link above], and Trumps' access to yet another nefarious spy organization, National Geospatial-Intelligence Agency, or NGA, as discussed in this article link. [NGA]
Gold and silver continue to be as important than ever. We have been strong advocates for buying and personally holding physical gold and silver in almost all of our articles over the past four-years+. It should not matter if purchases were made at higher prices. It is crucial that ownership and possession of physical PMs is accomplished. The window continues to be closing fast, and movement toward a cashless financial system will make future purchases too subject to government scrutiny. Finally, the insanity of all of the trillions of added debt, the unsustainability of the Western banking system, the failed public pensions waiting to blow-up in pensioner's face and wallets all beg for possessing gold and silver.
The paper markets, which the charts depict, may and more probably do not reflect reality, have had a surprising rally over the past month, one that has taken us by surprise, but we are not convinced it will continue. The only caveat in making that assessment is the fact that, at some point, gold and silver will not look back and will do nothing but accelerate in price. However, that condition should exhibit large upside movements and not the creeping, stair stepping fashion seen, of late.
Owning physical gold and silver makes one impervious to any surprise runaway rallies, for one's holdings will reflect any upside rising value. It may be more difficult for paper speculators to not be subject to surprise moves, up or down, and for that reason, we tend to be more cautious in interpreting developing market activity in the paper market. We are already prepared for any bull market by owning physical gold and silver, and we continue to advocate the same for anyone who has not yet purchased any, and for additional buying for those who have the financial wherewithal to do so.
Back to the "80 cent gap." Gaps happen for a reason, and they are favorable signs for a directional move. This is why we focused attention on that observation because it is an oversight by the manipulators, from our perspective. It may yet be filled, but after a year of not being filled, it may seem too insignificant to the moneychangers that have done everything possible to suppress the PMs markets.
We do not want to place too much emphasis on this circumstance, [even though we have], other than to acknowledge its surprising existence. It is not a breakaway gap leaving a trading range, for example, which would be more significant. The fact it was not closed at the time of overt market weakness, the lows of the current correction from 2011, sends a message, and we always look for and pay attention to market messages, the truest form of price information.
Why we give it this much attention is because it appears on every time from, even the annual chart, and this is a market rarity. Market synchronization is important for reading charts, a point we have often stressed in the past. Our view is that it could very well be an important tell that the Nov/Dec 2015 lows could mark the bottom, and that colors any strategy for interpreting current developing market activity, using that information as an anchor. We shall see over time.
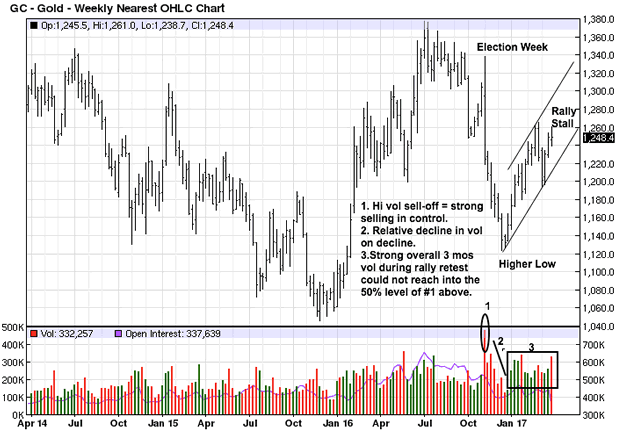
The up slanting channel, starting from the Dec '16 low, shows that the current rally has failed to reach the upper channel line drawn off the Feb high. The 1250 area also happens to be a 50% retracement from the July '15 high to the Dec '15 low. In a downtrend, the 50% area tend to act as resistance. In an up trending market, a 50% retracement is often ignored. In the present case, it is having an effect against bulls, for now.
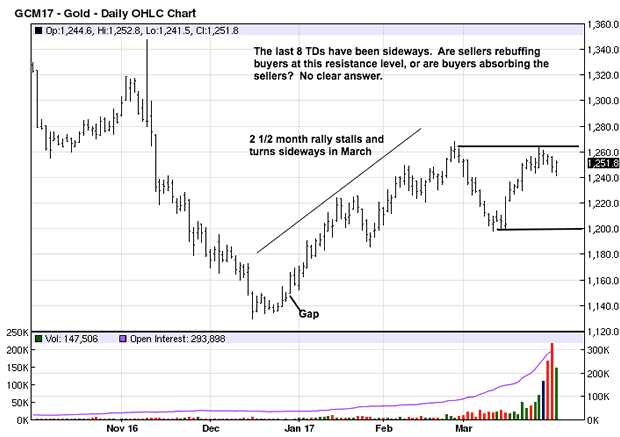
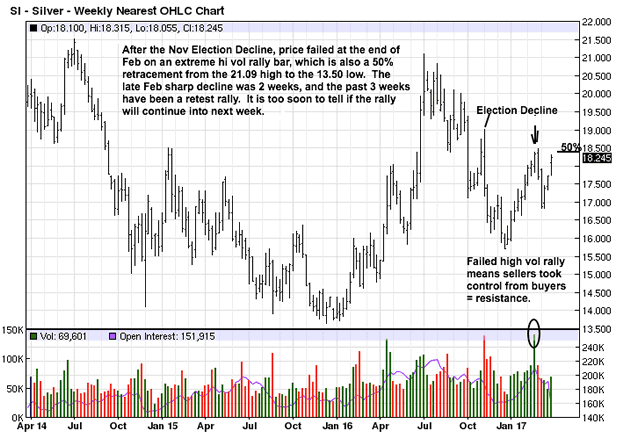
In addition to the stalled rally within the channel, the 50% retracement, price is failing to rally higher into the November wide range bar from the Election Week spill lower. There was a 2 week decline starting at the end of February, and this reaction rally to the upside has not fully retraced that move after 3 weeks of trying and trying on increased volume. If the increased volume [buying effort] could not rally price above 1260, unless there is immediate upside follow-through, a correction lower to uncover more demand will follow.
When you look at the entire chart, from left to right, price is in the middle of a protracted TR [Trading Range]. In the middle of a TR is where market information is at its lowest as to reliability. For as bad as economics are with world's [totally bankrupt] banking system, and with as many countries facing deep financial problems, border issues, and the struggle for existence as the globalists are creating financial ruin everywhere they rule, one would think gold would be responding with higher values, but the charts are not backing up that avenue of reality.
The moneychangers still rule, but their days are numbered. We just do not have a number to identify as to when "the end is near."
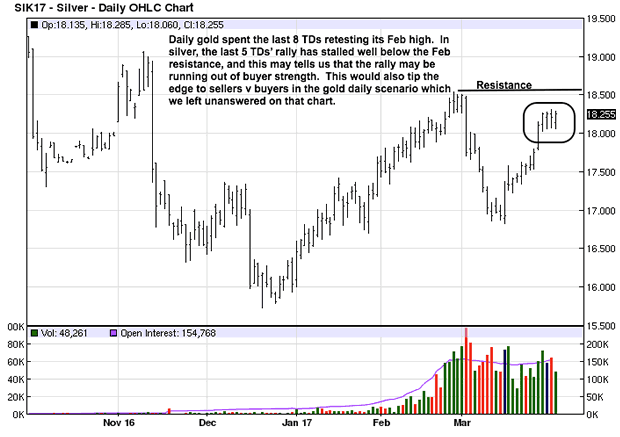
TDs = Trading Days. The 1260 area is near-term resistance, and price was unable to penetrate it after 8 TDs, thus creating a short-term TR.
Bearish Spacing occurs when the last swing high, the lower horizontal line from 2013, fails to rally to the bottom, or higher, of the last swing low, the upper horizontal line from the 2012 swing lows. This leaving of a space is bearish because the market is telling us sellers did not bother to wait to see if the last swing low would be successfully retested. Instead, sellers resumed their selling campaign, confident lower prices will prevail. 25 – 26.25 remains strong resistance.
The 22+ area is current resistance on the monthly and quarterly. You can see how far price is away from even retesting a 50% retracement at the 31+ level. No matter what you hear or read, the chart in front of you is showing weakness, not strength. Take heed, in terms of expectations in time, for time still favors silver laboring near current lows.
The high vol, circled, and the commensurate rally bar, [arrow pointing down] shows tremendous buying effort, but it was overwhelmed by sellers stopping the rally cold and preventing the range of that day from extending higher. It was then no surprise that a sell-off began right after. Again, this is how the market advertises participant's behavior, and it is why we say we watch what the market says about the participants instead of what participants have to say about the market. The market is always the final arbiter. Count on it.
Where gold was knocking on the 1260 resistance, here you see how silver was unable to even rally to its resistance line, moving sideways for the week well under that line. If we look at these "messages from the market," and shut out all that is being said and/or written about PMs, the message is clear. At this point, neither gold nor silver are in a position to initiate a substantial rally.
If proven wrong and the market takes off, those of us holding physical gold and silver will be quite delighted.
By Michael Noonan
Michael Noonan, mn@edgetraderplus.com, is a Chicago-based trader with over 30 years in the business. His sole approach to analysis is derived from developing market pattern behavior, found in the form of Price, Volume, and Time, and it is generated from the best source possible, the market itself.
© 2017 Copyright Michael Noonan - All Rights Reserved Disclaimer: The above is a matter of opinion provided for general information purposes only and is not intended as investment advice. Information and analysis above are derived from sources and utilising methods believed to be reliable, but we cannot accept responsibility for any losses you may incur as a result of this analysis. Individuals should consult with their personal financial advisors.
Michael Noonan Archive |
© 2005-2022 http://www.MarketOracle.co.uk - The Market Oracle is a FREE Daily Financial Markets Analysis & Forecasting online publication.