


Investors Should Pay Attention to Important Stock Market Divergences
Stock-Markets / US Stock Markets Aug 14, 2008 - 08:14 AM GMTBy: Marty_Chenard

 Market divergences tell a story of something, or some investor segment acting contrary to the market's movements.
Currently ... the DJI, NASDAQ, S&P, and the Russell are showing an up trending condition.
But, what if Institutions were selling while you were buying ... how would you feel then?
This morning, we will look at the Inflowing/Outflowing levels of Liquidity in the stock market and then the DIA and QQQQ ... ETFs for the DOW and NASDAQ 100. We will also compare the current market movement and divergence of the DIA/QQQQ to what is happening relative to Institutional investors.
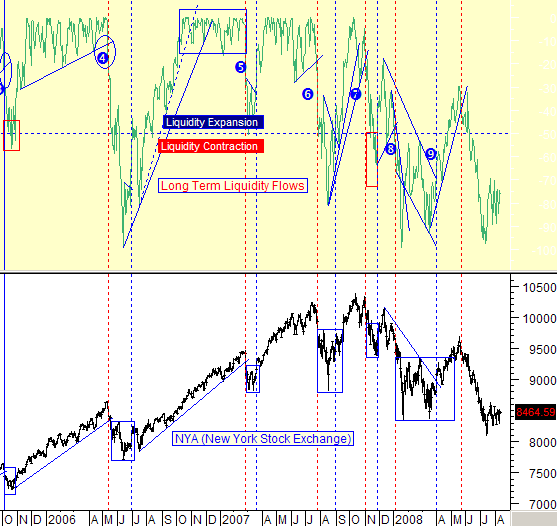
Let's start by looking at the amount and trend of Liquidity flowing into the stock market . This first chart shows the amount of Liquidity moving into the market compared to the action of the NYA (New York Stock Exchange Index).
What's important here, is the level of Liquidity and then its trending movement :
1. First, it is important whether Liquidity is in Expansion or Contraction. While in Expansion, money is flowing into the stock market and this always occurs during strong sustainable rallies. When Liquidity is in Contraction, money is moving out of the stock market. Currently, Liquidity is in Contraction.
2. Second, Liquidity has been in a trading range .
3. So, we have the indexes moving up while Liquidity is in contraction and in a trading range ... what is going on?
The answer is that Institutional investors have been selling while the smaller investor has been buying. Since over 50% of the market's volume comes from Institutional investors, that will be a big problem for the current rally. If Institutions seriously increase the amount of their selling, they will overpower the buying by smaller investors. If smaller investors seriously decrease the amount of buying while Institutions are selling, then that would also be a negative downside pressure. In other words, the risk levels are high in this current situation. (This stock market liquidity chart is posted every day on our paid subscriber site.) See the next chart ...
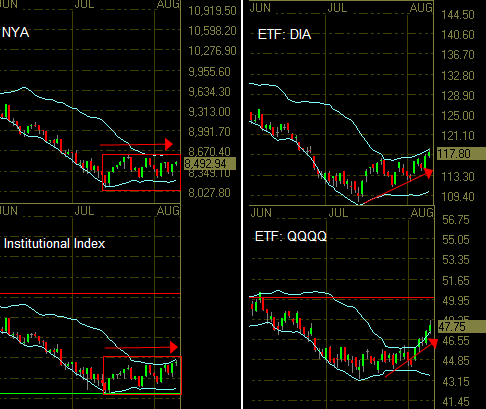
Now let's look at the action of the NYA and Institutional Index versus the action on the DIA and QQQQ.
What do you see?
The NYA and the Institutional Index have been moving sideways in a trading range ... not trending up like the DIA and the QQQQ. (The NYA is where all most of the Program Trading occurs. The Institutional Index represents the "top core holdings" held by Institutions.) The existing divergence and sideways trading range of these two is signifying that Institutions are "selling into this rally". Once again, that represents a high risk level for investors at this current stage.
If the Institutional Index of "core holdings" and the NYA (New York Stock Exchange Index) does not start trending up soon, the smaller investors will run out of steam and won't be able to keep the market moving up.
*** Feel free to share this page with others by using the "Send this Page to a Friend" link below.
By Marty Chenard
http://www.stocktiming.com/
Please Note: We do not issue Buy or Sell timing recommendations on these Free daily update pages . I hope you understand, that in fairness, our Buy/Sell recommendations and advanced market Models are only available to our paid subscribers on a password required basis. Membership information
Marty Chenard is the Author and Teacher of two Seminar Courses on "Advanced Technical Analysis Investing", Mr. Chenard has been investing for over 30 years. In 2001 when the NASDAQ dropped 24.5%, his personal investment performance for the year was a gain of 57.428%. He is an Advanced Stock Market Technical Analyst that has developed his own proprietary analytical tools. As a result, he was out of the market two weeks before the 1987 Crash in the most recent Bear Market he faxed his Members in March 2000 telling them all to SELL. He is an advanced technical analyst and not an investment advisor, nor a securities broker.
Marty Chenard Archive |
© 2005-2022 http://www.MarketOracle.co.uk - The Market Oracle is a FREE Daily Financial Markets Analysis & Forecasting online publication.