Walmart Stock Extending Higher - Elliott Wave Trend Forecast
Companies / Retail Sector Apr 25, 2017 - 02:33 PM GMT Walmart (NYSE: WMT) is the world’s largest company by revenue as well as the largest private employer in the world with 2.3 million employees. It’s an American multinational retailing corporation that operates as a chain of hypermarkets, discount department stores, and grocery stores. Despite being the biggest physical retailer in the world, Wal-Mart is still trailing back in e-commerce business as there is increased competition from online retailers in particular Amazon (NASDAQ: AMZN) which continues to gain market share as the world is merging to online shopping.
Warren Buffet reduced his shares in Wal-Mart, which he held since 2005, by roughly 90% last quarter. He indicated that the retail sector now looks too challenging and fewer people are choosing to go to physical stores, so Walmart’s competitive advantages in scale & distribution may not be as valuable as they once were.
Walmart’s stock is only up +9% this year compared to Amazon +19% rally which already made new all time high while WMT is still far from breaking its 2015 peak. However , last week it managed to break above 2016 peak so let’s the consequence for this technical move as the giant corporation already acquired a number of e-commerce companies, which means it’s looking seriously to move into the online retail world and investors seems to be liking the new changes.
Walmart Elliott Wave View:
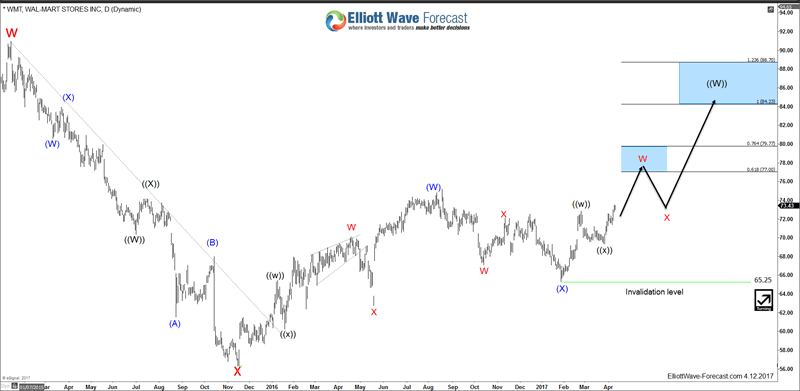
Walmart stock dropped 37% from 01/13/2015 peak at $90.8 before finding ground later that year. So from 2015 low, WMT could either has started a new cycle to the upside as the weekly trend remain bullish or the stock is only bouncing to correct that cycle before doing the double three correction from $90.8. Either way, the recent break above 2016 peak opened a new short term extension to the upside as WMT is now showing 5 swing bullish sequence from November 2015 low. So unless the move truncates or it’s a part of an irregular correction, then the stock has a new target that can take it toward $84 area before a larger pullback is seen.

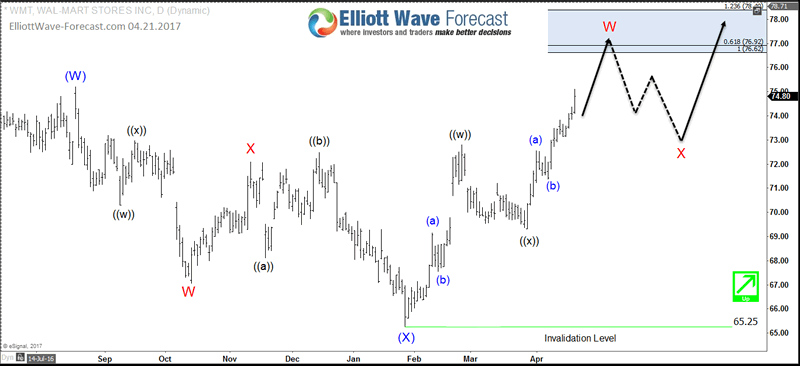
WMT established a low early this year at $65.25, from which it started a 7 swings structure move looking for a first target at equal legs area $76.62 – $78.61. From there the stock should pullback in 3 waves at least in red wave X before resuming the move higher while holding above January 2017 low.

The stock doesn’t need a large pullback and could keep extending higher forming a diagonal with the current leg as wave ((iii)). The surprise would happen if the current leg higher is wave B of a Flat structure in wave (X) which means there will be a sharp 5 waves decline after ending the current leg higher. But we don’t call Flats against the main trend which remain bullish until the move happens.
Recap:
Walmart may not look as a good long term investment as it used to be but the technical bullish sequence is suggesting that WMT price will see more gains during the rest of 2017 as short term investors still believe in the company. So while this year’s low is holding, corrective pullbacks will remain supported by the bulls.
For further information on how to trade forex, indices, commodities and stocks using Elliott Wave theory , take this opportunity and try our services 14 days for FREE . You will get access to our 52 instruments updated in 4 different time frames, Live Trading Room and 2 Live Analysis Session done by our Expert Analysts every day, 24 hour chat room support and much more.
By Ayoub Ben Rejeb
https://elliottwave-forecast.com
ElliottWave-Forecast has built its reputation on accurate technical analysis and a winning attitude. By successfully incorporating the Elliott Wave Theory with Market Correlation, Cycles, Proprietary Pivot System, we provide precise forecasts with up-to-date analysis for 52 instruments including Forex majors & crosses, Commodities and a number of Equity Indices from around the World. Our clients also have immediate access to our proprietary Actionable Trade Setups, Market Overview, 1 Hour, 4 Hour, Daily & Weekly Wave Counts. Weekend Webinar, Live Screen Sharing Sessions, Daily Technical Videos, Elliott Wave Setup .
Copyright © 2017 ElliottWave-Forecast - All Rights Reserved Disclaimer: The above is a matter of opinion provided for general information purposes only and is not intended as investment advice. Information and analysis above are derived from sources and utilising methods believed to be reliable, but we cannot accept responsibility for any losses you may incur as a result of this analysis. Individuals should consult with their personal financial advisors.
© 2005-2022 http://www.MarketOracle.co.uk - The Market Oracle is a FREE Daily Financial Markets Analysis & Forecasting online publication.


