Elliott Wave Theory: Is Elliott’s Theory Enough?
InvestorEducation / Elliott Wave Theory Apr 27, 2017 - 06:05 AM GMT By Daud Bhatti : Elliott wave Theory: Is Elliott’s Theory a system in itself?
As many traders know, The Elliott wave Theory is a form of technical analysis that finance traders use to analyze financial market cycles and forecast market trends by identifying extremes in investor psychology, highs and lows in prices, and other collective factors. Elliott’s Theory was developed by Ralph Nelson Elliott and published in 1938 in the book The Wave Principle. The Theory states that collective investor psychology, or crowd psychology, moves between optimism and pessimism in natural sequences. These mood swings create patterns evidenced in the price movements of markets at every degree of trend or time scale.
In Elliott’s Theory, market prices alternate between an impulsive, or motive phase, and a corrective phase on all time scales of trend, as the illustration shows. Impulses are always subdivided into a set of 5 lower-degree waves, alternating again between motive and corrective character, so that waves 1, 3, and 5 are impulses, and waves 2 and 4 are smaller retraces of waves 1 and 3. Corrective waves subdivide into 3 smaller-degree waves starting with a five-wave counter-trend impulse, a retrace, and another impulse. Motive waves always move with the trend, while corrective waves move against it.
We do understand the idea and we practice the idea every single day, we do over 4000 charts every month and we have seen that even when the Patterns happen because of the nature of the Market which comes with 2 sides, the bulls and bears which by definition is a fight between both of them. Reality is that most wavers practice the Theory looking for the 5 waves and 3 waves back and 90 % of the time they end up been wrong. We are not saying that Elliott’s Theory cannot be used, but by nature the Theory is great after the fact and not enough to forecast the future. As Humans, we tend to live in a state of denial and taking the easier road always come by nature. I started Elliottwave–Forecast in 2005 and did the analysis on the basis of Elliott Wave Theory. I was always looking for 5 waves and trading those waves 4’s and 5’s like everyone else does. With passage of time, I started opening my mind and understanding that the Theory is a way of communication instead of a way of forecasting. In simple words, the theory always is right after the fact but when market is moving and structures are developing, there is always more than one possible path and sometimes quite a few paths are there and none of them would break the rules of Elliott wave theory. That let me to believe that if Elliottwave-Forecast will stick around, it can’t be based only in Elliott’s Theory and other tools were needed. My Background comes from Engineering and consequently my mind is educated to see the patterns and think outside the box, I cannot be a blind follower, I need to think by myself, otherwise I won’t be me and lose my identity.
As time passed by, I started noticing something in the market, it was contrarian to what the Theory states. Theory states that that trend always comes in 5 but I noticed that trends can come in 5 waves and also in 3 waves. I also noticed the market following a code either by nature or through Human manipulation. As I said before, by nature I need to think outside the box and consequently, can’t follow blindly a Theory developed in the absence of Banks, Investment Houses and when the communication between humans was not even 5% of what it is today. There were no computers and consequently, no way Elliott’s Theory will work today, like it did in 1930’s. Today, we believe that: the Market follow patterns, but trend is not always in 5 waves, it can have an impulse sequence (5-9-13) or a corrective sequence (3-7-11). Traders need to have an open mind, otherwise will be showing only the charts or making money when the 5 waves happen which percentage wise are not that high specially when it comes to the Forex market. We believe in the Idea of cycles, sequences, time cycles, distribution, correlations and Elliott wave Patterns. We think a combination of tools makes up a forecast and not the Elliott Wave Theory or Market Psychology alone.
Few tips
- The Market trends in 5 waves and also trends in 3 waves.
- Elliott’s Theory needs to be part of a system, it’s not a system in itself.
- Trade areas when both bulls and bears are in agreement.
- Always looks for combinations of time frames.
- Follow the cycles in time and price, sequences and distribution.
- Understand that the MARKET is created and manipulated by someone using a code.
- Think outside the box.
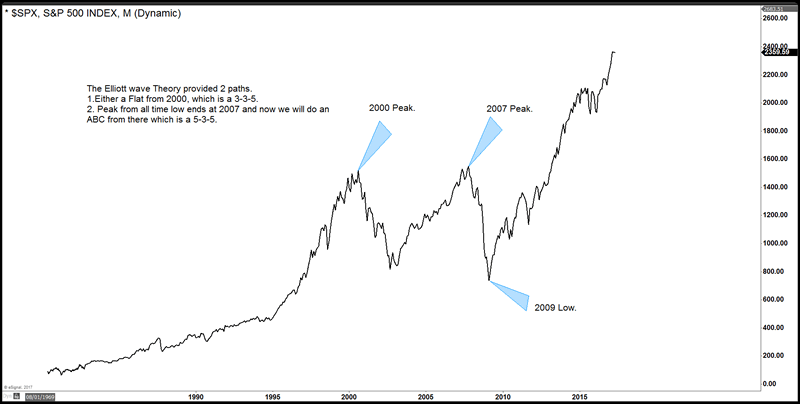
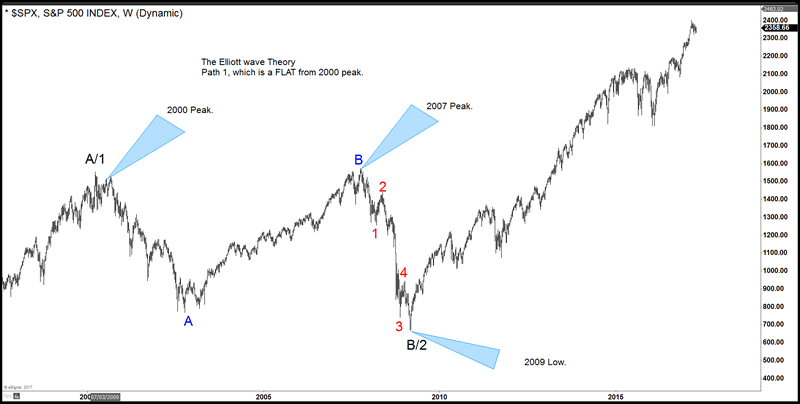
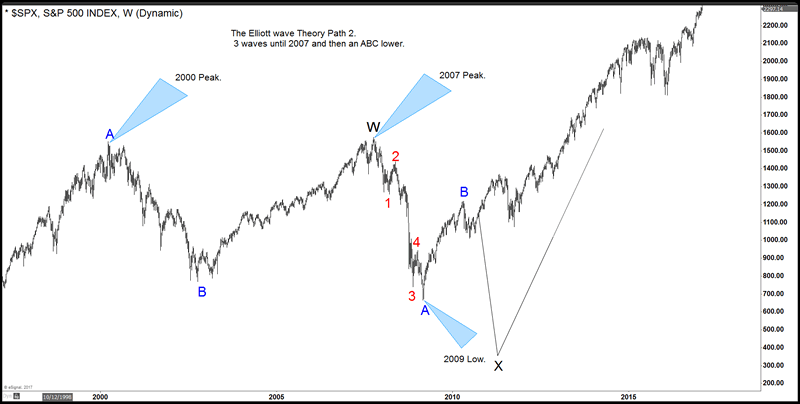
A great example is the $SPX, looking at the Monthly chart, the instrument peaked either in 2000 or in 2007. If you are practicing Elliott’s Theory like in 1930’s, you will see 5 waves from 2007 which will make your mind completely bearish and when the 5 waves ended in 2009, you would be calling for a recovery in 3 waves and then another 5 waves lower to the 300-200 areas. Truth is nothing denies that looking at the 5 waves down and also practicing the 1930’s Elliott Wave Theory. Reality is something else and needs to be seen with other tools and an open mind. The 2007 peak was a marginal new high above 2000 peak, also using a momentum indicator, it can be observed that momentum at 2007 peak is less than the momentum at 2000 peak which together with the 5 waves fast decline makes the case for a text book FLAT. As a new thinking with the Theory, we know that after 5 waves lower, a bounce will happen at least in 3 waves and before we start calling a huge crash in SPX and the World coming to an end, we want to see how the bounce develops and look for answers using market correlation. We are living in the present times, think differently and outside the box.


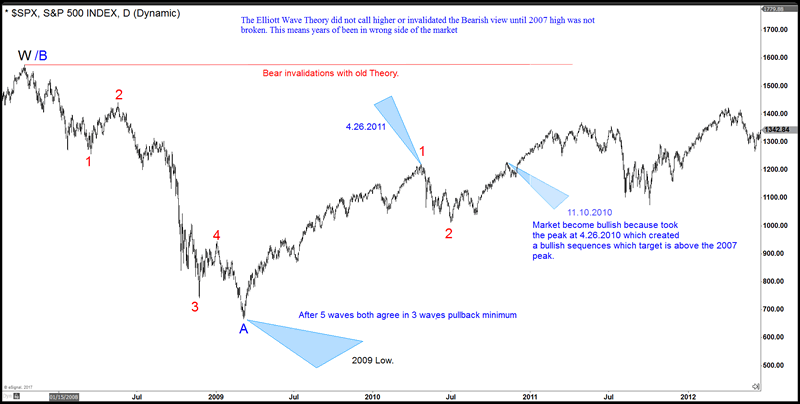
In early 2009, nothing denied the ABC Elliott wave structure in SPX from 2007 peak except for the momentum divergence at the peak. We use divergence differently than most because the divergence doesn’t always mean weakness, depending on the sequence sometimes it means incomplete sequence and more strength to come. As I said before, forecasting needs to be based off a system and not a single tool. Following the SPX, when the bounce started unfolding, we were looking for 3 waves higher because as per Elliott wave Theory hedging both sides agrees in the bounce until the moment when something within the system will called the next move. The SPX recovered and did 3 waves until 4.2010 and then dropped again, so far everything played out as planned and both scenarios were still valid until then. Then it rallied again from 7.2010 low and took the peak at 4.2010 and the moment it did that, sequence turned bullish calling for new high towards 2300 area. The bears lost that day and the ABC from 2007 was invalidated and from that day onwards, FLAT was the primary wave count. Primary reason for this was the moment 4.2010 peak was taken, 100% extension from 2009 low came above 2007 peak. Of course, Elliott wave Theory like 1930, did not deny the ABC until the 2007 peak was taken, but reality is that based on our out of the box thinking and not following the Theory like in 1930, we knew the SPX was bullish and will trade 2300 and even to 3000. To conclude, Elliott Wave Theory is not enough and trading only based in 5 waves and 3 waves back is a thing of the past, the past is past and future is ahead which requires thinking outside the box. We become better every day, we developed computers, Planes, Electricity thinking outside the box and the box is the Elliott wave Theory like was develop in 1930.


For further information on how to trade forex, indices, commodities and stocks using Elliott Wave theory , take this opportunity and try our services 14 days for FREE . You will get access to our 52 instruments updated in 4 different time frames, Live Trading Room and 2 Live Analysis Session done by our Expert Analysts every day, 24 hour chat room support and much more.
By Ayoub Ben Rejeb
https://elliottwave-forecast.com
ElliottWave-Forecast has built its reputation on accurate technical analysis and a winning attitude. By successfully incorporating the Elliott Wave Theory with Market Correlation, Cycles, Proprietary Pivot System, we provide precise forecasts with up-to-date analysis for 52 instruments including Forex majors & crosses, Commodities and a number of Equity Indices from around the World. Our clients also have immediate access to our proprietary Actionable Trade Setups, Market Overview, 1 Hour, 4 Hour, Daily & Weekly Wave Counts. Weekend Webinar, Live Screen Sharing Sessions, Daily Technical Videos, Elliott Wave Setup .
Copyright © 2017 ElliottWave-Forecast - All Rights Reserved Disclaimer: The above is a matter of opinion provided for general information purposes only and is not intended as investment advice. Information and analysis above are derived from sources and utilising methods believed to be reliable, but we cannot accept responsibility for any losses you may incur as a result of this analysis. Individuals should consult with their personal financial advisors.
© 2005-2022 http://www.MarketOracle.co.uk - The Market Oracle is a FREE Daily Financial Markets Analysis & Forecasting online publication.


