


Nervous Breakdowns in the Gold and Silver Precious Metals Markets
Commodities / Gold and Silver 2017 May 05, 2017 - 11:54 AM GMT

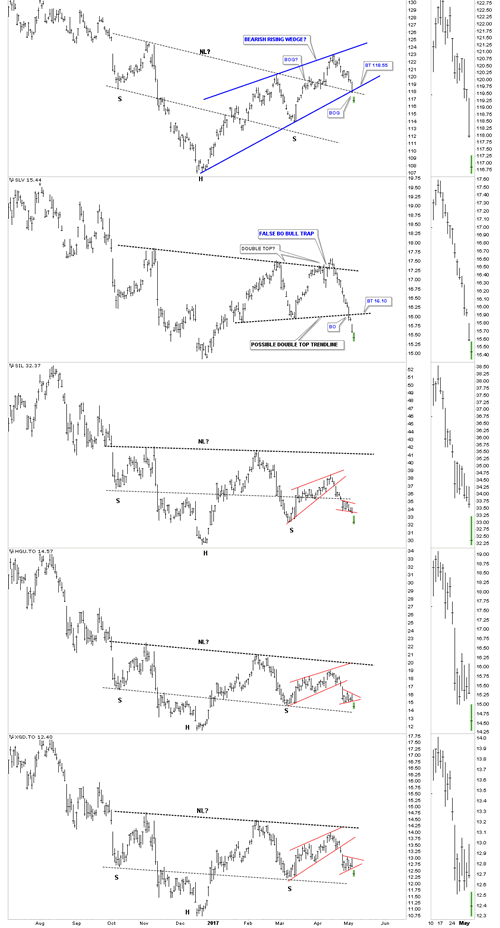
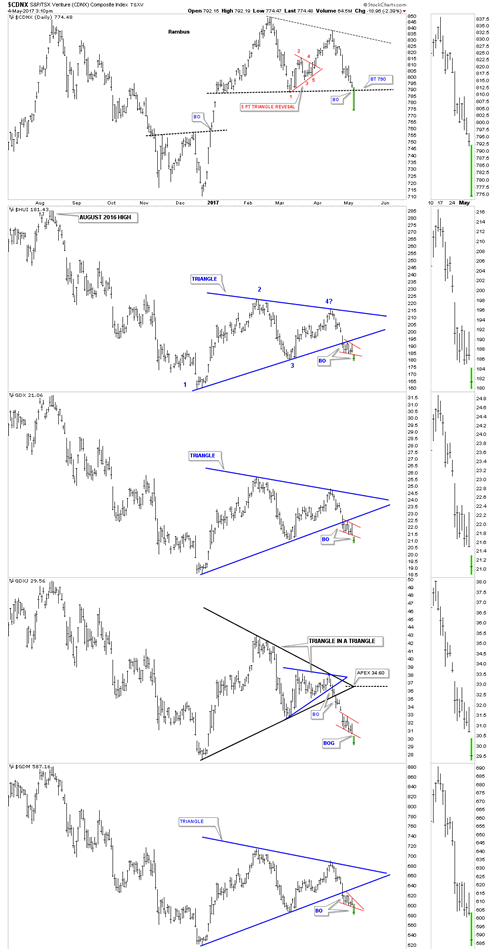
 The internet is slower than molasses in January and hard to annotate charts, but I got a few updated. Below is the combo chart for the PM complex we’ve been following which shows the dominate pattern being the triangle consolidation pattern. Just before I left the price action was breaking out below the bottom rail and I was looking for a possible backtest to the underside to take one last position. Some had a complete backtest but others didn’t. If you were lucky enough to get that last position great job.
When a consolidation pattern breaks out and the backtesting process begins that starts the impulse move down. As you can see most have built a small red consolidation pattern just below the bottom rail of their respective triangles which is usually a bearish setup. Today they gapped below the bottom rails of their small red consolidation patterns of which there are several different types, but all consolidation patterns. The next phase is now beginning in this impulse move out of the bigger blue triangle consolidation pattern.
GLD has been the strongest in the PM complex but today it’s joining the party to the downside gapping below the bottom rail of its bearish rising wedge. Before I left I showed a possible double top forming on SLV with a double top neckline which was tentative. Monday the price action broke below that potential double top trendline which is strongly suggesting the double top is in place. I still left a couple of untouched charts at the bottom of the combo chart which still shows the possible H&S bottom that a lot of PM investors believe is still working out. Again, if you see the low of the right shoulder violated that is a very strong warning the H&S pattern has failed.
After 4 months of waiting SLV is cracking the bottom rail of its 6 point diamond consolidation pattern.
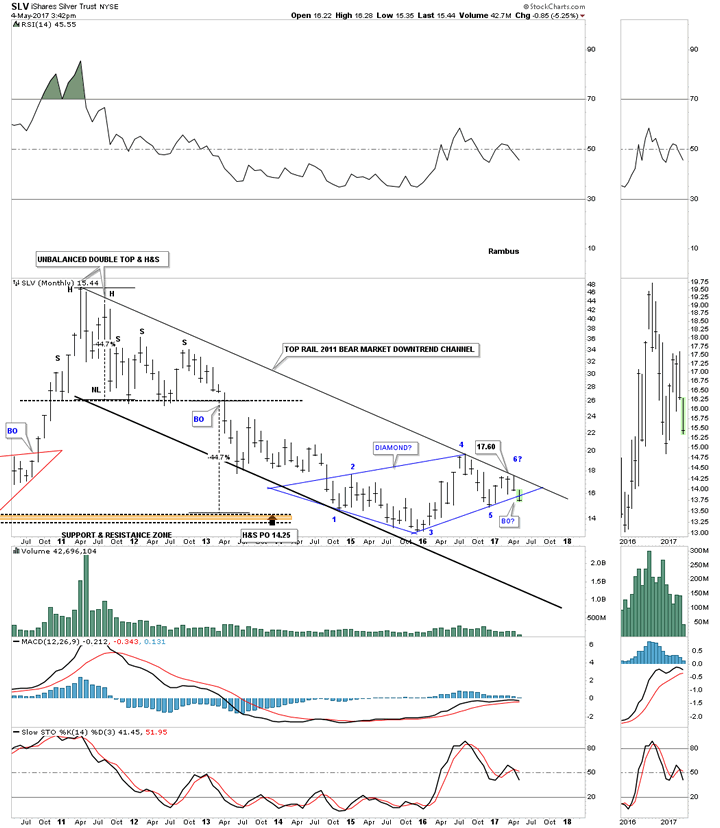
One last chart for SLV which shows the bear market downtrend channel with the diamond consolidation pattern.
I just want to thank Sir Plunger for his excellent Weekend and Wednesday reports along with Sir Fullgoldcrown for keeping everything under control. All the best…Rambus
All the best
Gary (for Rambus Chartology)
FREE TRIAL - http://rambus1.com/?page_id=10
© 2017 Copyright Rambus- All Rights Reserved
Disclaimer: The above is a matter of opinion provided for general information purposes only and is not intended as investment advice. Information and analysis above are derived from sources and utilising methods believed to be reliable, but we cannot accept responsibility for any losses you may incur as a result of this analysis. Individuals should consult with their personal financial advisors.
© 2005-2022 http://www.MarketOracle.co.uk - The Market Oracle is a FREE Daily Financial Markets Analysis & Forecasting online publication.