


Brace Yourself For The Coming Economic Transformation, Sliding Down the Social Class Scale
Politics / Social Issues May 11, 2017 - 05:38 PM GMTBy: John_Mauldin

 If the average person in the US feels as though they are going nowhere fast, there is a real reason for it.
Federal Reserve data shows people are earning less than they did 17 years ago. But the real story is even worse than that.
The chart below shows that median income in the US is actually down over the last 17 years and is only 3% higher now than it was 30 years ago. Those are inflation-adjusted numbers.
But the reality is that, for the average person, inflation has been much higher than the average of 2% per year over that time. This is because the things that the average person actually buys—like housing and education and health care and all the other necessities of life—are rising at a much faster rate than 2%.
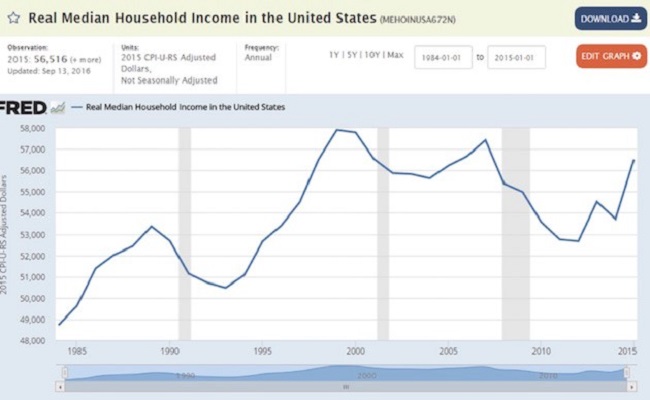
Source: FRED: St. Louis Federal Reserve
So this chart reflects the fact that life has gotten much more difficult for average Americans. If people’s incomes haven’t grown beyond what they were 30 years ago, they struggle just to make ends meet and to maintain the lifestyle they had.
Growth Is An Illusion For More Than Half Of Americans
The Census Bureau updates its income figures about once a year, and the last real update we had was last fall (taking us through 2015).
Doug Short did an analysis of those numbers. He breaks the country into quintiles, calculates the average household income for each quintile, and then also shows the top 5%. Notice that the average income for the top 5% is $350,000.
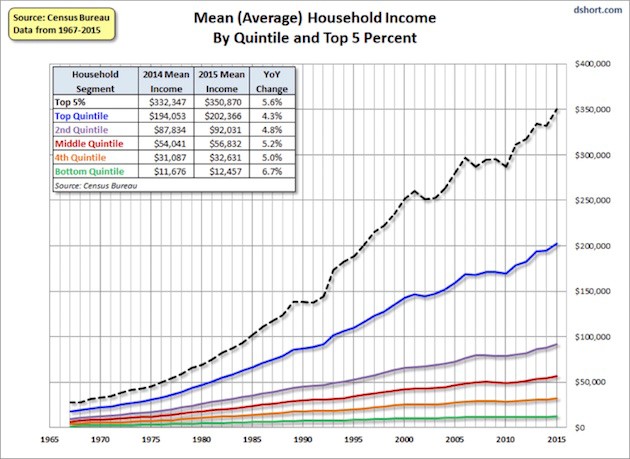
Source: Advisor Perspectives
It looks like everybody’s income is rising, especially those in the top 20% and 5%. But if we inflation-adjust those numbers, the illusion of growth goes away.
What we see now is that there has been almost no movement for the bottom 60%. The middle quintile has grown somewhat, and—this won’t surprise anyone—the top 20% and 5% have done very well.
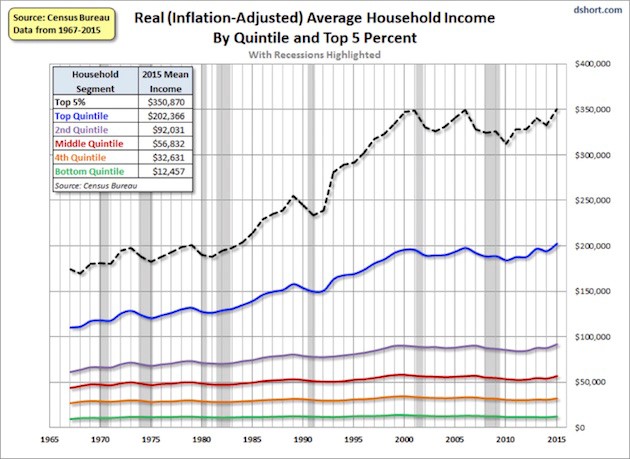
Source: Advisor Perspectives
The next chart shows what that growth looks like in percentage terms. We find that the bottom quintile saw their income grow by only 25% over the last 49 years. That’s less than 0.5% per year.
Interestingly, the fourth quintile grew even less than the bottom one, at around 19%, mainly because of government programs that supported those in the lowest 20%.
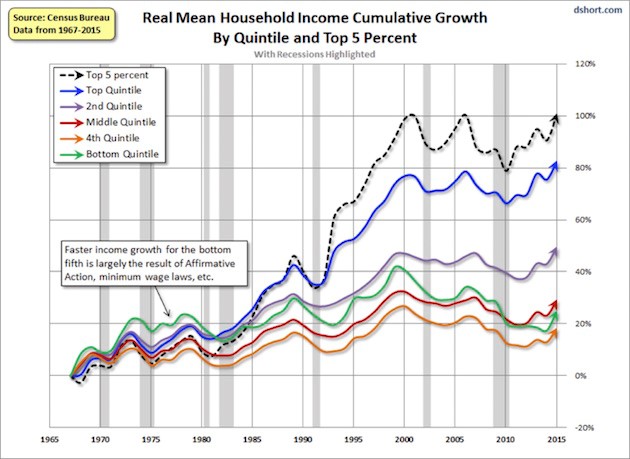
Source: Advisor Perspectives
But what about the 1%, I hear you asking? Investopedia gives us that answer:
To be certified as a one-percenter, you needed to bring home an adjusted gross income of $465,626 or more for the 2014 tax year, according to data from the IRS. The Washington Center for Equitable Growth put the average household income for this group at $1,260,508 for 2014.
But as the saying goes, your mileage may vary. It turns out there is quite a lot of variation among counties around the US as to what it takes to qualify for the top 1%. The chart below illustrates this well.
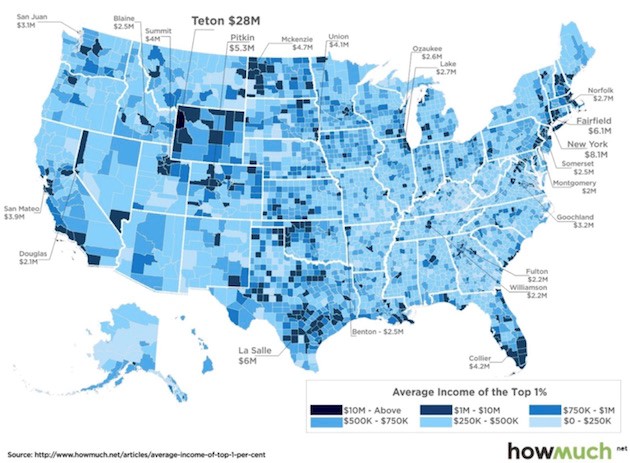
Source: howmuch.net
People Worry About Sliding Down The Class Scale
Not only are people making less, more people are worried about staying where they are financially (or not sliding down) than are trying to figure out how to get up to the next level.
The possibility that we might slide down the class scale is the source of much angst. Upper-income people worry they will decline to mere upper-middle-class status, while the middle class doesn’t want to join the ranks of the lower class.
It’s not so much that those upper-income people are worried about being middle class. It’s that they have created expenses and lifestyles around a certain level of income. If that income falls, they will have to change the lifestyle they have become used to.
That is remarkably difficult for many of us to do. Our sense of self-esteem and emotional well-being are, it seems, tied to our lifestyle.
Whether your worries are groundless or real, those fears are greater if you know you’re at the lower end of your peer group. The wealthiest .001% don’t have to worry—they’ll be fine in just about any scenario. But people in the 85th–95th percentiles are in danger of taking a fall in the next big market and economic upheaval.
And of course, the lower middle in the 25th–50th percentiles are very vulnerable to downward mobility.
The Transformation Is Coming
Whatever our income or class, we all face challenges over which we have some influence, yet we may find ourselves subject to a fate that we can’t control. The challenge that we have today is to recognize that the political, economic, and investment forces that we have become used to dealing with over the last 70 years are getting ready to shift more radically than we can even imagine.
We will have to think more deeply and creatively than ever about how to prepare for the changes—the transformation—coming to our lives.
Get a Bird’s-Eye View of the Economy with John Mauldin’s Thoughts from the Frontline
This wildly popular newsletter by celebrated economic commentator, John Mauldin, is a must-read for informed investors who want to go beyond the mainstream media hype and find out about the trends and traps to watch out for. Join hundreds of thousands of fans worldwide, as John uncovers macroeconomic truths in Thoughts from the Frontline. Get it free in your inbox every Monday.
John Mauldin Archive |
© 2005-2022 http://www.MarketOracle.co.uk - The Market Oracle is a FREE Daily Financial Markets Analysis & Forecasting online publication.