


Stock Market Day Trading Strategies and Brief 20th May 2017
Stock-Markets / Stock Market 2017 May 21, 2017 - 05:44 AM GMT

 Technically Speaking
1. Technical Summary:
Short Term Trend: Consolidating.
Medium Term Trend: Bullish.
Long Term Trend: Bullish.
28 Day Stochastics: Overbought.
14 Day Stochastics: Nearing Oversold.
VIX: Breakout From Bottom Of Range.
McC. Oscillator: Moving To The Bottom Of Range.
A/D Line: Bullish.
Chart: Dow Jones 19th May 2017. Timeframe: Daily.
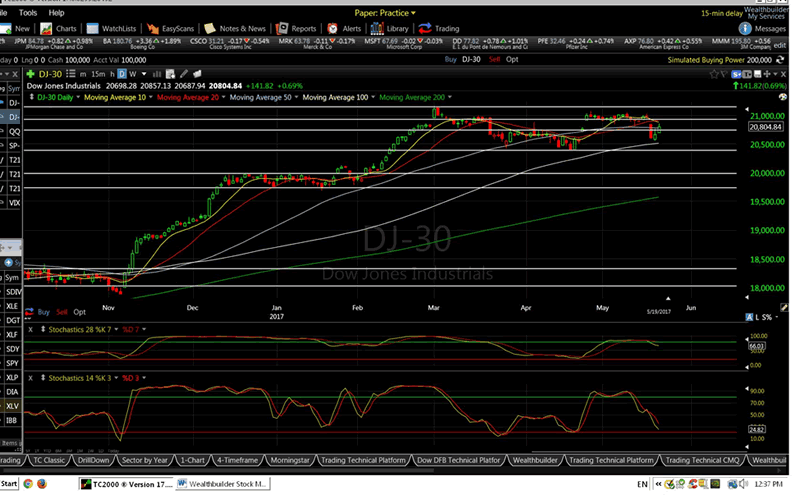
The market is now consolidating with a bearish tone. If the 100 DMA (Daily Moving Average) price point is broken (20,510) the next significant support level is the 20,000 mark.
Of all the main USA indices the Dow Transports is the weakest. If it breaks its 200 DMA we will have significant Dow Theory Divergence in play. Divergence tells us there is above average market risk. Thus if the FED raises interest rates next June, as expected, and indicates any sense of hawkishness the Trump rally could begin to come under severe strain, particularly if his tax reform policy is stalled.
Day Trading Strategies.
As part of my trading system I have 7 day trading strategies that I teach. In the March 16th Brief I explained the Straddle Trade. Today I list all the other 6 strategies, with actual examples of trades in action, courtesy of the IG Markets Spread Betting Platform (see note below). From experience I have found the 3 minute time frame to be most effective for day trading, thus all attached charts have this time setting.
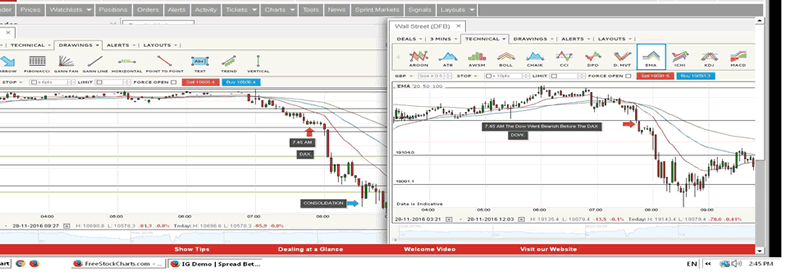
1. Arbitrage Trade
The Arbitrage Trade seeks to activate trades that have a high probability of success by utilizing early bearish or bullish movement on the Wall St DBT to trade the German DAX or vice versa.
Chart: Wall Street Daily Funded Bet/ German Dax Daily Funded Bet: 26th. Nov 2016: Time Frame 3 Mins.
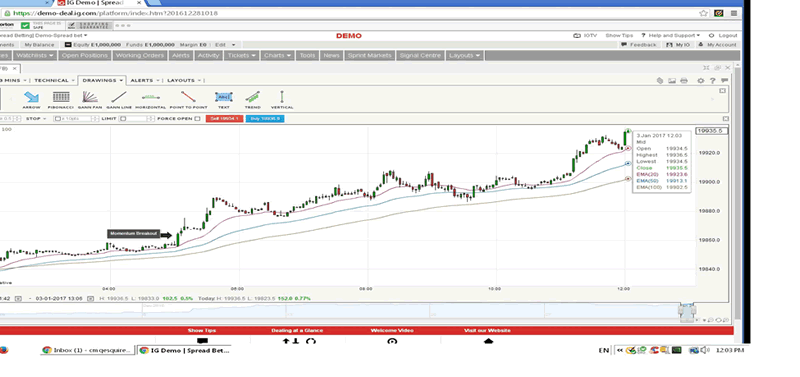
2. Momentum Trade.
With the momentum strategy one aims to enter a strong trend and remain in the position as long as technicals are supportive.
Chart: Wall Street DFB: 3rd. Jan 2017: Time Frame 3 Mins.
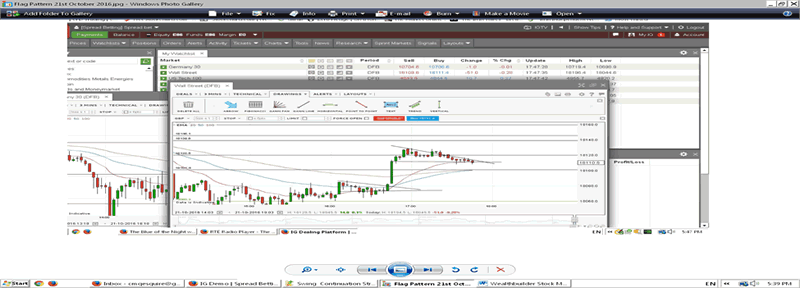
3. Swing/Continuation Pattern Trade.
The objective of this strategy is to identify high probability swing or continuation pattern trades.
A. Flag Formation.
The flag pattern forms what looks like a rectangle. The rectangle is formed by two parallel trend lines that act as support and resistance for the price until the price breaks out. In general, the flag will not be perfectly flat but will have its trend lines sloping.
Chart: Wall Street DFB: 21st Oct 2017: Time Frame 3 Mins.
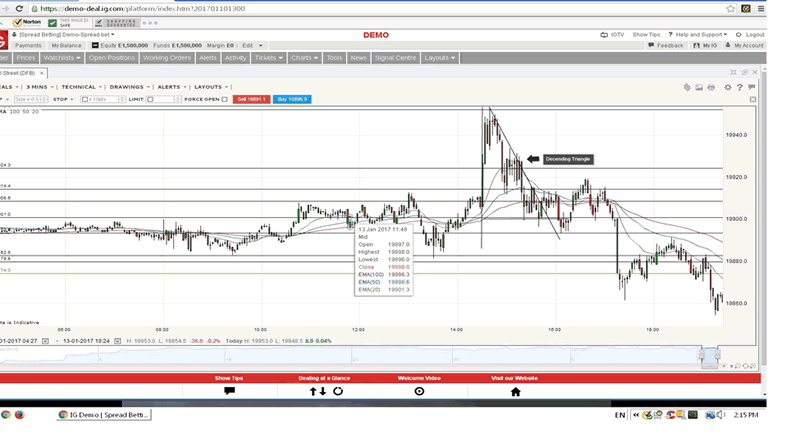
B. Descending Triangle Formation.
The descending triangle is a bearish formation that usually forms during a downtrend as a continuation pattern. No one can tell for sure how long it will last. There are instances when descending triangles form as reversal patterns at the end of an uptrend, but they are typically continuation patterns. Regardless of where they form, descending triangles are bearish patterns that indicate distribution.
Chart: Wall Street DFB: 13th Jan 2017: Time Frame 3 Mins.
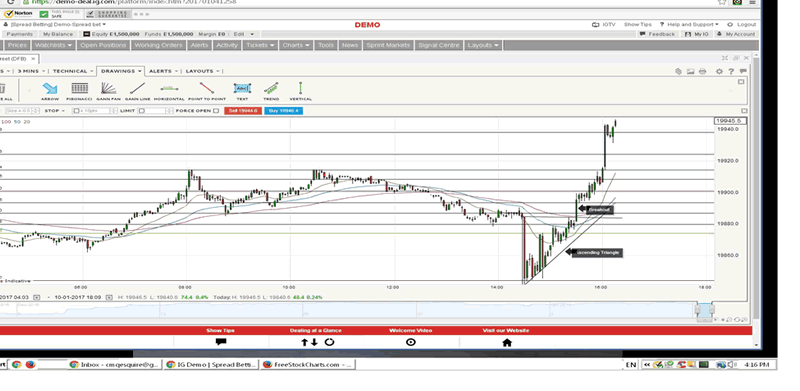
C. Ascending Triangle Formation.
As above but the ascending triangle is a bullish formation that usually forms during an upward trend as a continuation pattern.
Chart: Wall Street DFB: 10th Jan 2017:Time Frame 3 Mins.
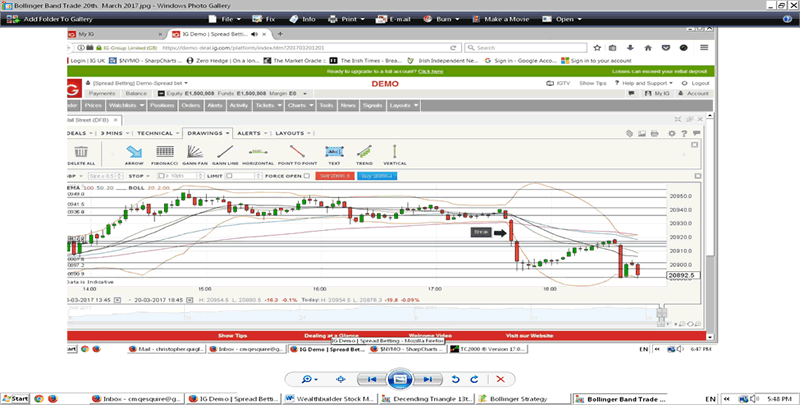
4. Bollinger Band Trade
The Bollinger Band Squeeze occurs when volatility falls to low levels and the Bollinger Bands narrow. Periods of low volatility are often followed by periods of high volatility. Therefore, a volatility contraction or narrowing of the bands can foreshadow a significant advance or decline. Once the squeeze play is on, a subsequent band break signals the start of a new move.
Chart: Wall Street DFB: 20th March 2017: Time Frame 3 Mins.
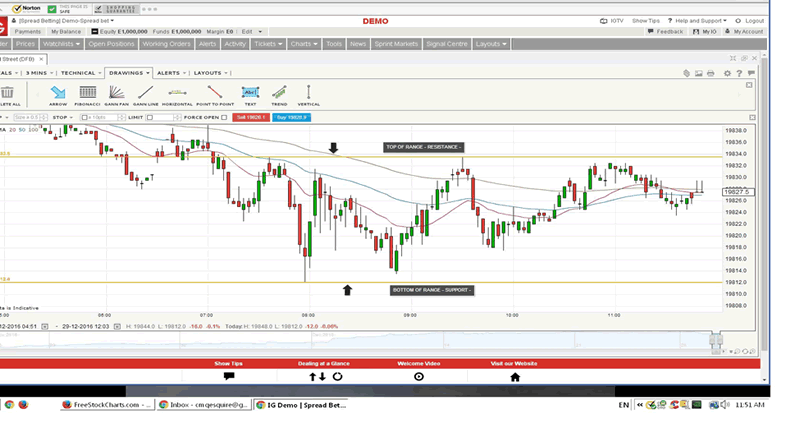
5. Channel/Range Trade.
In the context of technical analysis, a channel is defined as the area between two parallel lines and is often taken as a measure of a trading range. The upper trend line connects price peaks (highs) or closes, and the lower trend line connects lows or closes.
Chart: Channel Trade: 21st Oct. 2016: Time Frame 3 Mins.
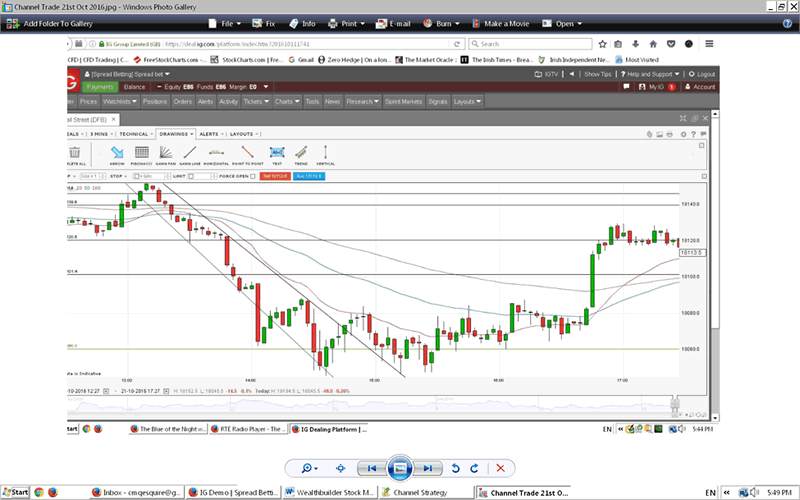
Chart: Range Trade: Wall Street: 29th Dec 2016: Time Frame 3 Mins.
6. Candlestick Pattern Trades
Candlestick pattern trades seek to “scalp” profits through trading highly recognizable candlestick formats.
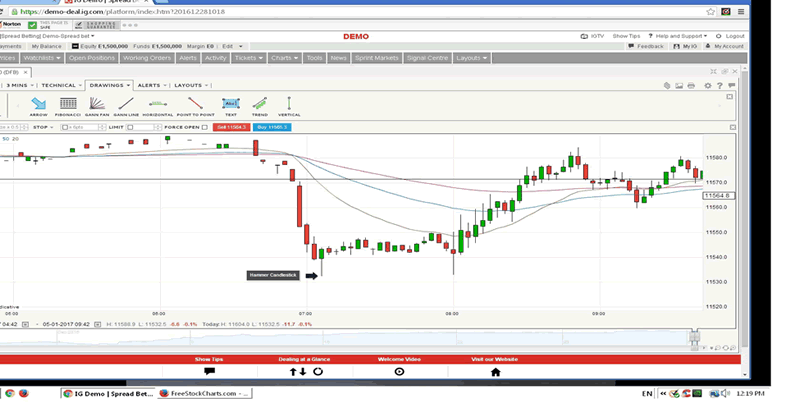
A. Formation: Hammer.
The hammer pattern normally appears when a short term down trend is about to change. The longer the length of the taper the better.
Chart: German DAX: 5th. Jan 2017: Time Frame 3 Mins.
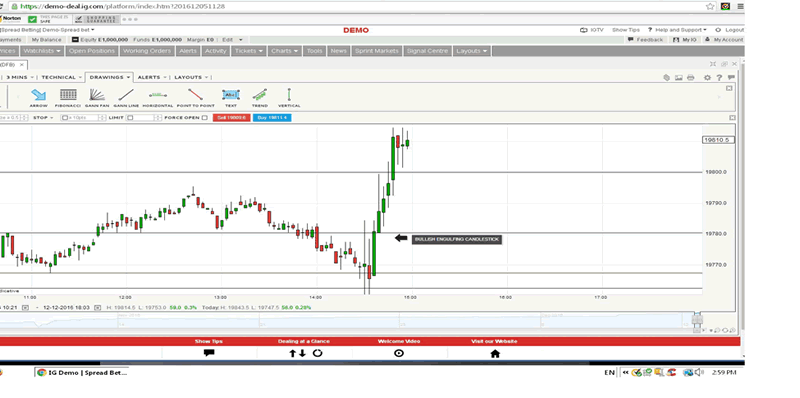
B. Formation: Bullish Engulfing.
With the bullish engulfing formation pattern the longer the bullish candle the higher the probability that the BUY move it indicates will persist.
Chart: Wall Street DFB: 12th Dec 2016.
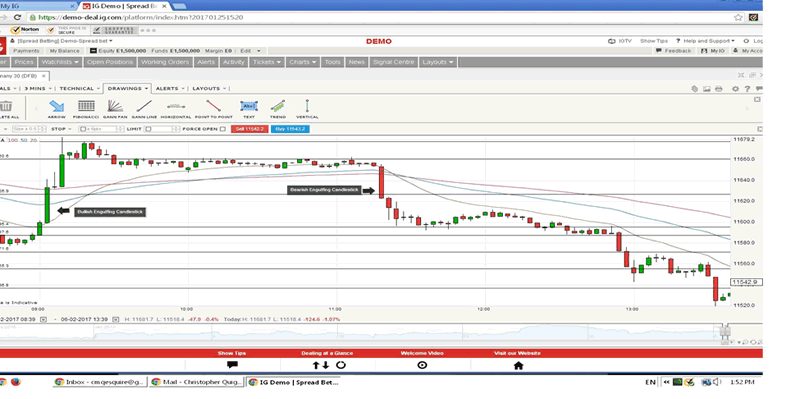
C. Formation: Bearish Engulfing.
The bearish engulfing formation pattern indicates the higher the probability that a SELL price movement is in the ascendance.
Chart German DAX: 6th Feb 2017: Time Frame 3 Mins.
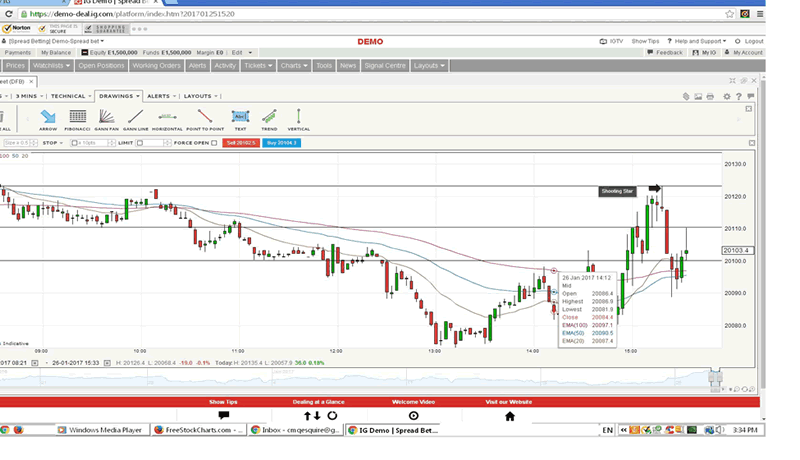
D. Formation: Shooting Star.
The shooting star pattern normally appears when a short term up-trend is about to change. The longer the length of the taper the better.
Chart: Wall Street DFB: 26th. Jan 2017: Time Frame 3 Mins.
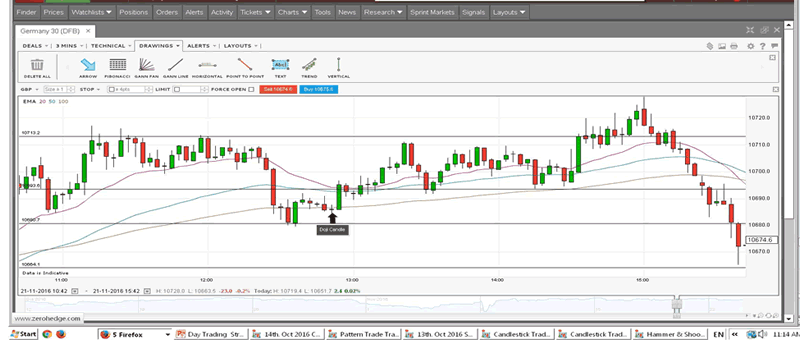
E. Formation: Doji.
The Doji pattern normally appears when there is complete indecision as to future trend. The next significant candle that appears after the Doji is used to anticipate trend.
Chart: DAX DFB: 21st Nov 2016: Time Frame 3 Mins.
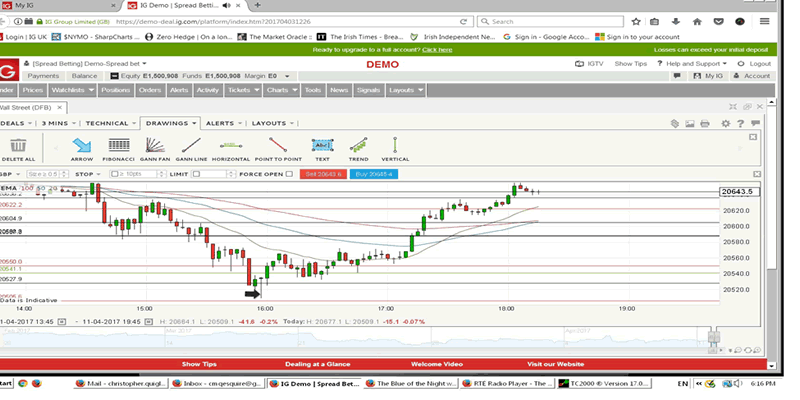
F. Formation: Spinning Top.
Like the Hammer the Spinning Top pattern normally appears when a short term down trend is about to change. The longer the length of the taper the better
Chart: Wall Street DFB: 11th April 2107: Time Frame 3 Mins.
Note:
The Wall Street Daily Funded Bet (DFB) is the IG Markets instrument for trading the Dow Jones Industrials Index.
The German DAX Daily Funded Bet (DFB) is the IG Markets instrument for trading the German DAX Index.
Charts Courtesy of Worden Bros. and IG Markets.Co.UK.
Christopher Quiqley
B.Sc., M.M.I.I. Grad., M.A.
http://www.wealthbuilder.ie
Mr. Quigley was born in 1958 in Dublin, Ireland. He holds a Bachelor Degree in Accounting and Management from Trinity College Dublin and is a graduate of the Marketing Institute of Ireland. He commenced investing in the stock market in 1989 in Belmont, California where he lived for 6 years. He has developed the Wealthbuilder investment and trading course over the last two decades as a result of research, study and experience. This system marries fundamental analysis with technical analysis and focuses on momentum, value and pension strategies.
Since 2007 Mr. Quigley has written over 80 articles which have been published on popular web sites based in California, New York, London and Dublin.
Mr. Quigley is now lives in Dublin, Ireland and Tampa Bay, Florida.
© 2017 Copyright Christopher M. Quigley - All Rights Reserved
Disclaimer: The above is a matter of opinion provided for general information purposes only and is not intended as investment advice. Information and analysis above are derived from sources and utilising methods believed to be reliable, but we cannot accept responsibility for any trading losses you may incur as a result of this analysis. Individuals should consult with their personal financial advisors before engaging in any trading activities.
Christopher M. Quigley Archive |
© 2005-2022 http://www.MarketOracle.co.uk - The Market Oracle is a FREE Daily Financial Markets Analysis & Forecasting online publication.