


US Dollar Cycle : Deep Dive
Currencies / US Dollar May 21, 2017 - 05:56 PM GMTBy: SurfCity

 I thought I would start off this weekend by recapping one of the most important aspects of Walter Bressert’s Cycle Theory. Very simply put, it is that Longer Cycles almost always dominate the shorter Cycles. This is Huge because if you understand where you are in the Longer Cycles, trading the shorter ones becomes much easier.
Is the USD really topping here? This is an extremely importing Cycle call here because if it is, Gold and the broader Commodity Complex may well be ready to become much more bullish going forward. There is no doubt that the USD has been very bullish since 2014 but this post and related charts will provide you with why a trend change maybe upon us.
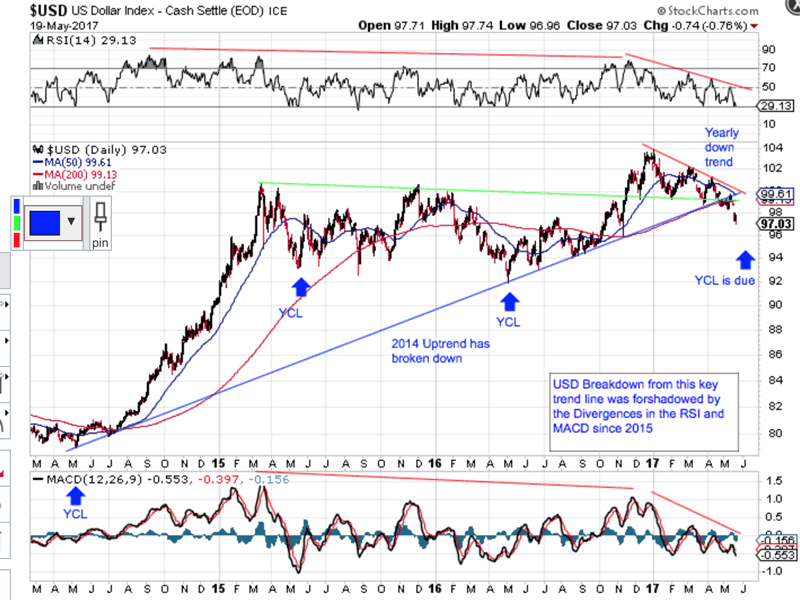
Let me be clear that the USD will find its next low at some point, likely a Yearly Cycle Low (YCL ~ see my 4th chart where I show the last 3 YCL have been in the May timeframe), but if I am correct, most of its future rallies will be corrective in a longer term downtrend that I believe has started.
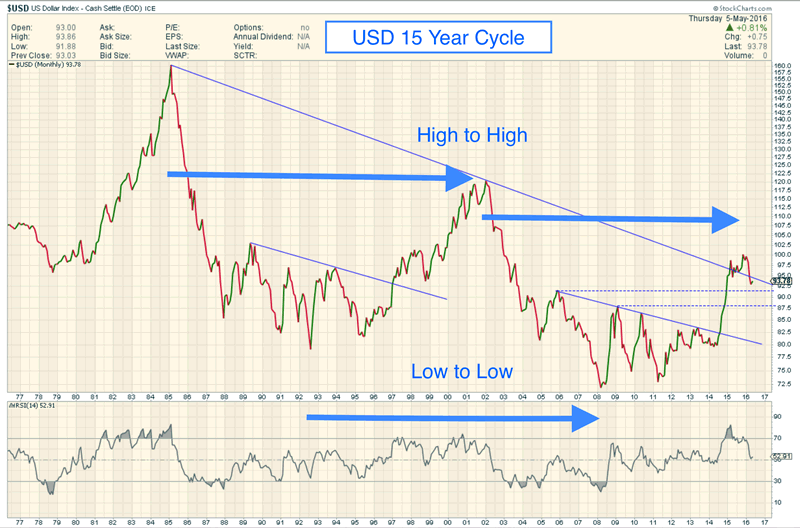
The USD’s shortest Cycle that I track is its Trading or Daily Cycle which has a Low to Low timing band of 18-25 days on average. The USD also has a 5-6 month Intermediate Cycle like everything else. It also has a Yearly Cycle (2 Intermediate Cycles), a Three Year Cycle (3 Yearly Cycles) and a 15 Year Super Cycle (5 of the USD’s 3 Year Cycles).
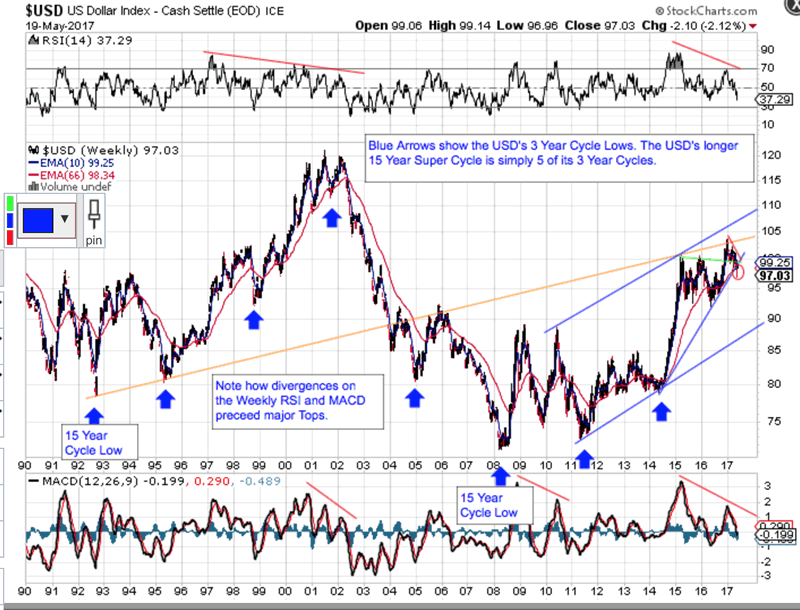
Let us start with the USD’s longest Cycle, its 15 Year Super Cycle. My work show USD’s last 15 Year Low was in 2008 (see first two charts). After chopping sideways from 2008 to 2014, the USD made an extremely bullish move into its recent top which places us now in year 9 of its 15 year Super Cycle. Based on the breakdown of its 2014 uptrend line, I believe the USD’s 15 Year Super Cycle has topped. If I am correct, this should be bullish for Gold and the broader Commodity complex.
The Blue arrows in my charts point out Cycle Lows but as the charts cover different timeframes, so are the types of Cycle lows that are being highlighted. My first two charts are long term weekly covering 20-40 years. The second chart shows the USD’s 3 Year Cycle Lows and its last two 15 Year Super Cycle Lows.
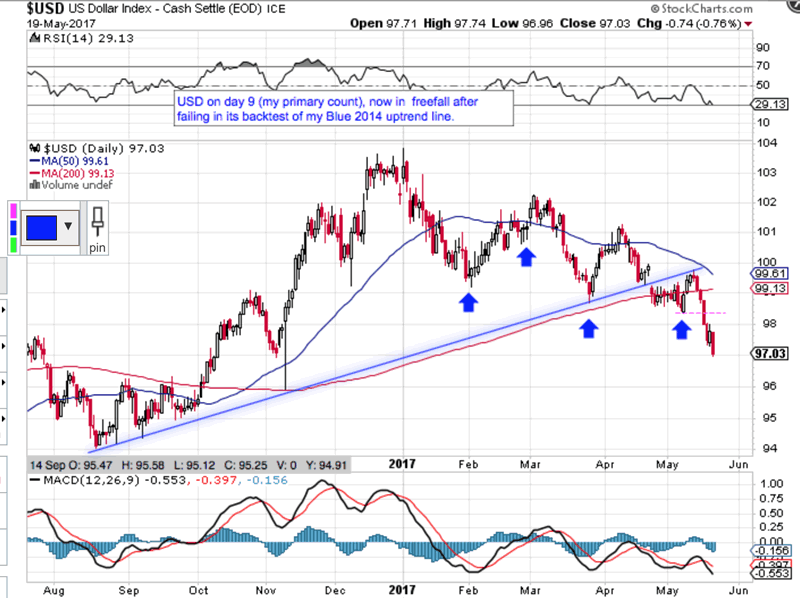
My last two charts are 3 Year and 1 Year charts. The 3 Year chart shows Yearly Cycle Lows (YCLs) and the One Year chart shows the last 4 shorter term Trading Cycle Lows.
By Surf City
Everything about Cycle Investing
© 2017 Surf City - All Rights Reserved
Disclaimer: The above is a matter of opinion provided for general information purposes only and is not intended as investment advice. Information and analysis above are derived from sources and utilising methods believed to be reliable, but we cannot accept responsibility for any losses you may incur as a result of this analysis. Individuals should consult with their personal financial advisors.
© 2005-2022 http://www.MarketOracle.co.uk - The Market Oracle is a FREE Daily Financial Markets Analysis & Forecasting online publication.