


Randgold Resources Short Term Bullish Sequence
Commodities / Gold and Silver Stocks 2017 May 24, 2017 - 04:04 PM GMT

Randgold Resources (NASDAQ: GOLD) was founded 22 years ago in 1995, it’s a gold mining business operating in Africa mainly in Mali. The price of Gold & Silver dropped significantly early this month, which put a lot of pressure on mining stocks, but Randgold was one of the strongest and managed to rally %14 to make new 2017 high. Let’s take a look at the technical chart to show the potential path.
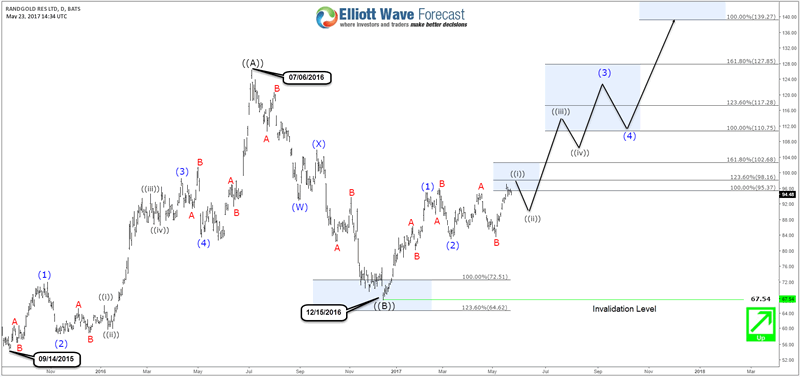
Since the September 2015 low, GOLD rallied in 5 waves diagonal structure, then topped in July 2016 like the precious metals. The stock corrected that rally in a double three structure which reached the equal leg area $72.51 – $64.62 and ended the 7th swing lower. So it held above 2015 low ($54) and bounced from the inflection area to create a higher low sequence supporting the idea of GOLD resuming the rally to the upside.
The Elliott Wave structure can be labeled in different ways depending on how the move will develop and the current most aggressive view would be another 5 waves from December 2016 low with the first wave already in place. Consequently, as the stock already made a new high last week then it’s now showing an incomplete bullish sequence from the lows that would at least take the stock higher toward equal leg area $110.75 – $117.28. So currently the pullback that should happen from the $98.16-$95.37 area, needs to hold on March low and buyers need to step up for the rally to resume higher. The alternative view if the pivot at March low breaks then GOLD would be doing a flat structure from February peak and still in wave (2) which should ideally hold above $67.54 low to support the bullish view.
The short term path can be adjusted according to new price action but while pivot at December 2016 low is intact then the stock should extend higher to reach the equal leg area around $140 from 2015 low. That move can be counted as a simple Zigzag structure and take some time before it happens but it can also be a part of a new impulse sequence and accelerate to the upside.
Randgold Recap
The overall picture for the Randgold is suggesting more gains be seen in the future that could take the mining stock toward $110 as a first step before breaking to new all-time highs targeting $140. The move will be supported by a recovery in the precious metals and using Gold to Silver Ratio could be a good proxy to identify the right timing to start the next leg higher.
If you enjoyed this article, feel free to take a look at our Technical Blog and also check the Chart of The Day .
For further information on how to trade forex, indices, commodities and stocks using Elliott Wave technique , try us 14 days for FREE . You will get access to our Professional Elliott Wave analysis in 4 different time frames, Daily Elliott Wave Setup Videos , Live Trading Room and 2 Live Analysis Session done by our Expert Analysts every day, 24 hour chat room support, Weekly Technical videos and much more so if you are not a member yet, use this opportunity and sign up to get your FREE trial
By Ayoub Ben Rejeb
https://elliottwave-forecast.com
ElliottWave-Forecast has built its reputation on accurate technical analysis and a winning attitude. By successfully incorporating the Elliott Wave Theory with Market Correlation, Cycles, Proprietary Pivot System, we provide precise forecasts with up-to-date analysis for 52 instruments including Forex majors & crosses, Commodities and a number of Equity Indices from around the World. Our clients also have immediate access to our proprietary Actionable Trade Setups, Market Overview, 1 Hour, 4 Hour, Daily & Weekly Wave Counts. Weekend Webinar, Live Screen Sharing Sessions, Daily Technical Videos, Elliott Wave Setup .
Copyright © 2017 ElliottWave-Forecast - All Rights Reserved Disclaimer: The above is a matter of opinion provided for general information purposes only and is not intended as investment advice. Information and analysis above are derived from sources and utilising methods believed to be reliable, but we cannot accept responsibility for any losses you may incur as a result of this analysis. Individuals should consult with their personal financial advisors.
© 2005-2022 http://www.MarketOracle.co.uk - The Market Oracle is a FREE Daily Financial Markets Analysis & Forecasting online publication.