


Ethereum Showing Elliott Wave Path for Bitcoin Price
Currencies / Bitcoin Jun 02, 2017 - 03:01 PM GMT

 Ethereum is an open-source blockchain-based distributed computing platform featuring smart contract functionality. It provides a decentralized Turing-complete virtual machine, the Ethereum Virtual Machine (EVM), which can execute scripts using an international network of public nodes. Ethereum also provides a crypto-currency token called “ether”, which can be transferred between accounts and used to compensate participant nodes for computations performed.
Ethereum went live in 2015, it quickly gained attraction in the digital world and it’s currently the second largest Crypto-Currency with 20 Billion Dollar in market cap surpassing Ripple (11 Billion) and sitting behind the Bitcoin (39 Billion). Since the start of 2017 , all the digital currencies doubled its value after after prices kept rising higher in the recent months and buyers all over the world jumping in to take a piece of the rally.
Looking at the some daily charts of the digital coins, you’ll probably see a parabolic curve to the upside which may seems hard to catch any trade. However using our swing sequences and following the trend which is clearly bullish as the instrument keeps making higher highs then buying the pullbacks in 3 , 7 or 11 swing was the right way to catch every dip during the recent rally.
Let’s take a look at the lower time frame chart of Ethereum and Bitcoin and explore the potential scenarios.
Ethereum: ETHUSD 4H Chart 05/31/2017
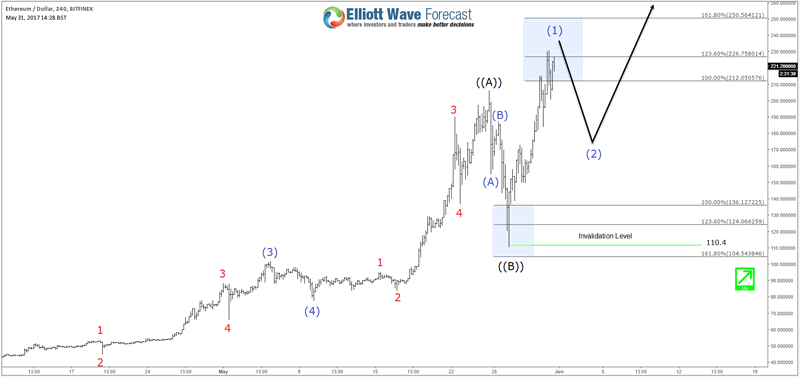
Ethereum saw a 50% decline from 05/25/2017 peak which may caused a lot of fear around the market, but looking at the technical picture the correction came after a 5 waves move from the lows and that why it was another great opportunity to buy ETHUSD after 3 waves zigzag pullback into the equal legs area 136 – 104. The instrument already rallied from the inflection area and managed to make a new all time highs opening a new extension to the upside toward ideally 315 – 365 area. In the shorter term, a pullback from 225 – 250 can be seen against 110 low but it can be just a shallow 3 waves pullback before Ethereum resumes the rally again as it has an incomplete bullish sequence.
BITCOIN: BTCUSD 1H Chart 05/31/2017
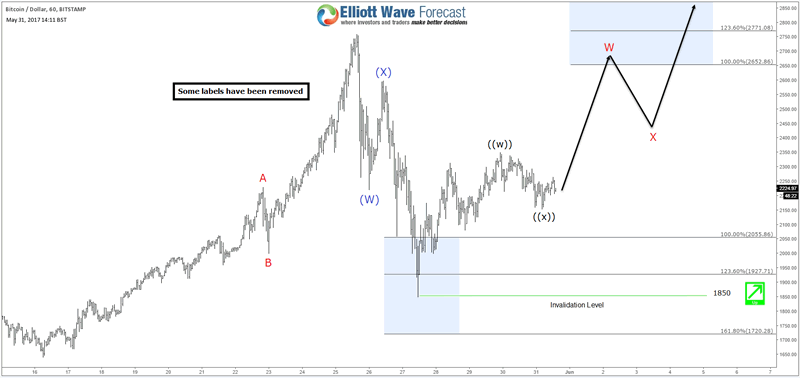
The same thing happened for Bitcoin which saw a 65% correction from 05/25 peak which unfolded as a double three structure and managed to finish the 7th swing around the equal legs area 2055 – 1720. The reaction from that area wasn’t strong enough to break to new high like the case of Ethereum but BTCUSD created a short term incomplete bullish sequence from 05/27 low which could take it toward equal legs area 2652 – 2771 before another pullback is seen. Bitcoin still needs to break the previous peak to open a new extension highs that can take it another $1000 higher. However if it fails to make new highs then there is still the possibility for a double correction which will represent another opportunity to buy it again.
Recap
Ethereum is the one leading the move for the rest of crypto-currencies as ETHUSD already made new all time highs and opened the door for another leg to the upside, which means Bitcoin should ideally follow the same path even it’s currently still lagging the equivalent move.
Buying crypto-currencies is the hot theme for 2017, investors has already added different types of digital coins to their portfolio and traders are trying to catch the long side of the rally. However there is huge volatility with these kind of instrument which causes sharp declines in few hours that can trick short term traders and may cause a lot of problem. That’s why unless you are owning these crypto-currencies from lower levels and looking to hold it for a long time then it’s better to pay attention to the market structure and learn how identify the right sequence and cycle to allow you to buy it the right area to protect you trade after the first reaction.
If you enjoyed this article, feel free to read other posts in our Technical Blog. For more information on using Elliott Wave theory to trade forex, indices, commodities and stocks, take this opportunity and Try our services 14 days for FREE. You will get access to our 52 instruments updated in 4 different time frames, Live Trading Room and 2 Live Analysis Session done by our Expert Analysts every day, 24-hour chat room support and much more.
Ayoub Ben Rejebhttps://elliottwave-forecast.com
ElliottWave-Forecast has built its reputation on accurate technical analysis and a winning attitude. By successfully incorporating the Elliott Wave Theory with Market Correlation, Cycles, Proprietary Pivot System, we provide precise forecasts with up-to-date analysis for 52 instruments including Forex majors & crosses, Commodities and a number of Equity Indices from around the World. Our clients also have immediate access to our proprietary Actionable Trade Setups, Market Overview, 1 Hour, 4 Hour, Daily & Weekly Wave Counts. Weekend Webinar, Live Screen Sharing Sessions, Daily Technical Videos, Elliott Wave Setup .
Copyright © 2017 ElliottWave-Forecast - All Rights Reserved Disclaimer: The above is a matter of opinion provided for general information purposes only and is not intended as investment advice. Information and analysis above are derived from sources and utilising methods believed to be reliable, but we cannot accept responsibility for any losses you may incur as a result of this analysis. Individuals should consult with their personal financial advisors.
© 2005-2022 http://www.MarketOracle.co.uk - The Market Oracle is a FREE Daily Financial Markets Analysis & Forecasting online publication.