


Can a Chart Pattern Help You Catch a Strong Bond Rally? Yes
Interest-Rates / US Bonds Jun 03, 2017 - 04:41 AM GMTBy: EWI

 Plus, find out about a dangerous flaw in a "buy-and-hold" stock market strategy
The Elliott wave model has helped investors catch market turns for eight decades.
As Frost & Prechter's Wall Street classic book, Elliott Wave Principle, says:
The Wave Principle is the best forecasting tool in existence. [It] imparts an immense amount of knowledge about the market's position … and its probable ensuing path.
Of course, the proof is in the pudding.
Or, in this case, the bond market.
Elliott Wave International recently applied their knowledge of Elliott wave price patterns to the bond market, and the forecast they shared with their subscribers turned out to be ... well, you be the judge.
Let's start with this chart and commentary from Prechter's March 2017 Elliott Wave Theorist:
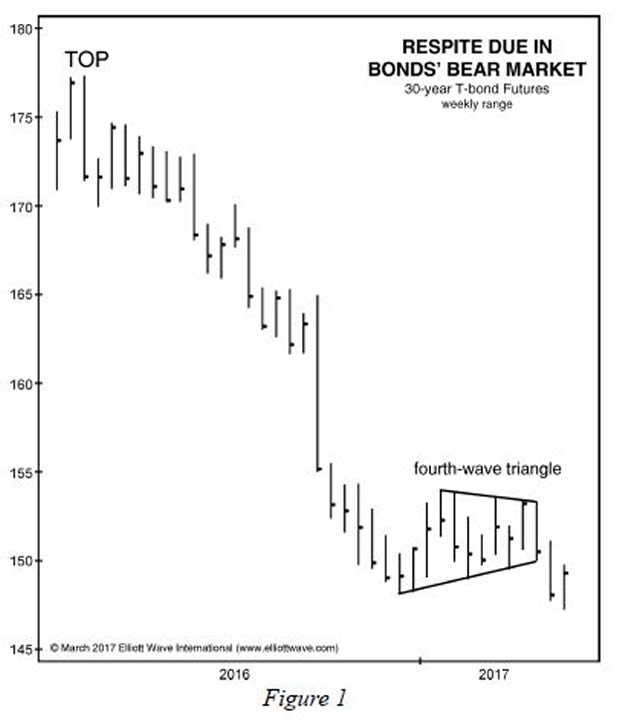
As shown in the chart above, the consolidation in bond futures prices from December through February took the shape of a triangle, a formation that typically appears in the wave four position within an impulse. So, this month's new low in bond prices is likely occurring within a fifth wave from last year's high, suggesting that a substantial rally should develop this spring.
The Elliott Wave Theorist published March 17, and its forecast for a "substantial rally" proved timely: The 30-year U.S. T-Bond price low of 145^26.0 registered on March 14, and since then, long-bond prices have indeed moved northward.
You can see this rally [entire wave labeling available to subscribers] in the 30-year U.S. T-Bond in Elliott Wave International's May 22 Short Term Update chart:
As you can see, the price rallied to a high of 155^16.0 on April 18 -- a 6% advance in a month! Recently, after a short retreat, the climb resumed.
Before concluding, let's briefly shift focus to the stock market -- specifically, the claimed average gain of 7.228% during the past 116 years that investors have allegedly been making annually.
"Buy and hold" proponents often point to that annual gain figure. Problem is, in reality, investors pocket substantially less -- and that has direct implications for your portfolio.
In fact, once you review the 3-page, eye-opening section in the March Elliott Wave Theorist, which includes 4 tables and a large graph, you'll learn just "how difficult it has been to earn any real return in the market."
Here's the good news: You can read the entire 10-page March 2017 Elliott Wave Theorist 100% FREE -- but only for a limited-time. Read below for details.
Get a free issue of market legend Robert Prechter's Elliott Wave Theorist now
Read this eye-opening issue now and you'll get a clear picture of what's next for stocks, bonds and oil and more to help you jump on opportunities and sidestep risk. This free issue (a $29 value) will show you Prechter's unique outlook and give you a new perspective on the markets you won't get anywhere else.
Download your FREE issue from Robert Prechter now -- for a limited time.
This article was syndicated by Elliott Wave International and was originally published under the headline . EWI is the world's largest market forecasting firm. Its staff of full-time analysts led by Chartered Market Technician Robert Prechter provides 24-hour-a-day market analysis to institutional and private investors around the world.
© 2005-2022 http://www.MarketOracle.co.uk - The Market Oracle is a FREE Daily Financial Markets Analysis & Forecasting online publication.