The Stock Market Crash of 2017 That Never Was But Could it Still Come to Pass?
Stock-Markets / Stock Market Crash Jun 03, 2017 - 04:48 AM GMTBy: Sol_Palha

 I add this, that rational ability without education has more often raised a man to glory and virtue, than education without natural ability.
Marcus T. Cicero
For the past few years much the angst of many experts we have consistently stated that the markets were not ready to crash. From late 2016 to early 2017, many former Bulls who predicted the direction of this market quite well, suddenly decided that the stock market was ready to crash. We, however, begged to differ, and we provided two very simple reasons for our stance.
Emotions drive the markets:
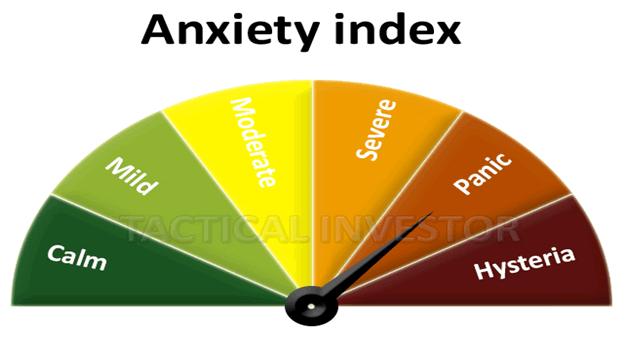
The masses have remained nervous throughout this bull run; no bull market has ever ended when the masses are nervous. History indicates that stock market crashes begin on a euphoric note and end on a note of hysteria.
The trend
We focus more on the psychology of the masses than on any other single factor. However, the 2nd most important factor is the trend. The trend has remained positive throughout this bull run; occasionally it has moved into the neutral zone, but it has never turned negative. We are not talking about the trend based on the drawing of simple trend lines but one that is calculated utilizing several factors one of which happens to price action.
So when the experts started to scream over and over again about the impending stock market crash of 2017; these are some of the comments we recently made to our readers and or subscribers
Let the experts sing their songs of doom and con the masses; it takes two to tango, one to cry and three to have a party. We have experts from the technical analysis side and experts employing fundamentals trying to use to back their faulty assertions. Unfortunately for these penguins both of them are wrong. They have failed to pay attention to the psychological factor. There is no factor more important when it comes to playing the markets then market psychology. Market Update April 30, 2017
The market marches to its beat and those that resist are drained; financially speaking that is. We are not fortune tellers; we reserve that noteworthy task for the experts who seem to take delight on spewing rubbish week after week. The media then regurgitates this rubbish, and a jackass is suddenly made to look like a movie star. What a wonderful world we live in and people wonder why they lose money after listening to these wise men.
We, on the other hand, prefer to listen to what the market is saying and that is why we never listen to our gut instinct or let our emotions into the equation. We look for trends. Market Update May 19, 2017
What has been the most nonplussing factor in this bull market?
The emotional state of the masses; the herd, for the most part, has been oscillating back and forth from the neutral to the Bearish camps; very few have dared to venture into the bullish camp. This probably explains why the bullish readings never even came close to testing the 60% ranges for the past 15 weeks and counting. During that time the market has been trending higher and higher. This has caught many an expert with his pants down. But there is no surprise here; the reason as we have stated so many times over and over again is that the Crowd is not euphoric and the trend is still bullish.
The same pattern holds true for most of 2015 and 2016; the number individuals in the Bearish and neutral camps outnumbered those in the bullish camp. If you are in the Neutral camp one of two things one of two things apply; you are either are a bear that got burned or Bull with no courage to take a position.
Our proprietary sentiment indicator also confirms that the masses are still antsy.

Market Structure
If the markets were extremely overbought, then it should be almost impossible to find stocks that are trading in the oversold ranges on the monthly charts. On a monthly chart, each bar represents one month’s worth of data on; these charts provide great clues of what to expect from the markets.
In the Dow, we spotted several stocks that were trading in the extremely oversold ranges to oversold ranges on the monthly charts. AAPL, HD, DIS and NKE are examples of such stocks.
We also examined roughly 150 random Midcap to large cap stocks (ETF’s were included in this analysis) from various sectors; we found that almost 60% of the stocks examined were trading in the oversold ranges; one ETF that caught our eye was IBB; it is trading in the extremely oversold ranges.
We also noted that the net number of new 52 week highs continuously exceeded the net number of new 52 week lows. Why is this important? It indicates that the internal structure of the market is healthy.
The Alternative Dow Theory factor
Our stance for the past 11 years has been that the Dow Theory is dead; we provided an alternative Dow Theory that has proven to be far more accurate than the original. This theory states that it is the utilities that should be followed and not the transports. We will cover this in more detail in a follow-up article next week. In essence, it is the Utilities that lead the way and not the transports.

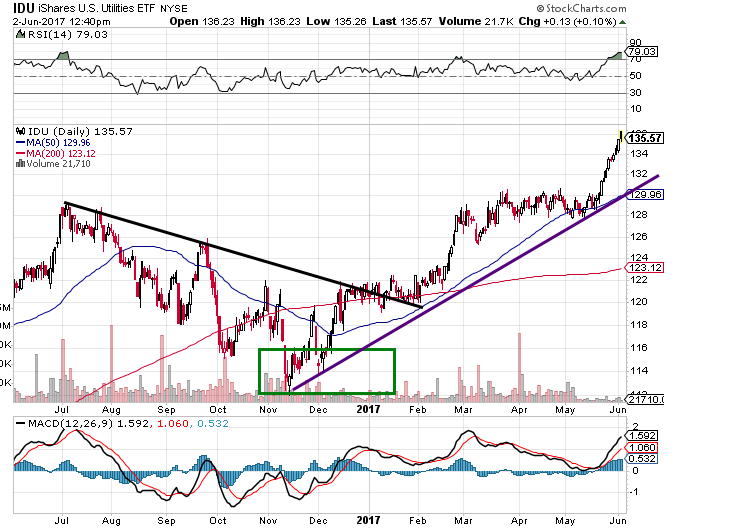
The utilities started to consolidate roughly from Aug of 2016 and bottomed out in Nov 2016. The utilities had consolidated for roughly three months before they started to trend upwards. The utilities are now surging to new highs, and this bodes well for the overall market. The alternative theory states that the Dow should follow suit.
This is a mature bull market so one should not expect it to trend in one direction only; it will experience several corrections ranging from mild to severe. Unfortunately, the Dr’s of doom will confuse this correction for a crash as they have mistakenly done so for the past eight years and counting. When the masses embrace this market, the end will be close at hand; until then strong corrections should be embraced.

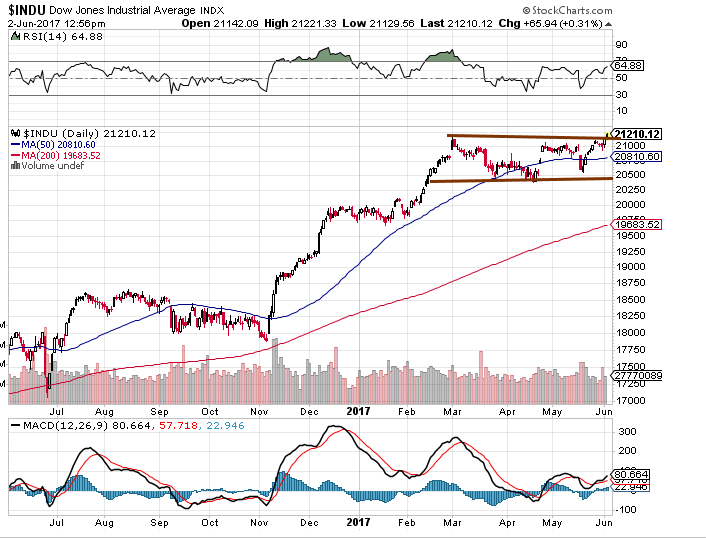
There is a lag period between the utilities and the Dow; sometimes it comes down to just a few weeks, but usually, it ranges from 3-5 months. The Dow has been consolidating since March; it has essentially been trading in a tight range. Even though the Dow did not pull back strongly, the sideways action helped it blow out a large dose of steam as envisioned by the MACD’s and several other technical indicators that are trading in the oversold ranges. The lag period was roughly three months as the utility bottomed out in Nov and the Dow started to consolidate in March of 2017.
Conclusion
The stock market crash theme makes for great headlines as fear sells well, but that is all it has been good for so far. The market will experience a much stronger correction over the course of the next 6-15 months, but until the masses embrace this bull market, those corrections will prove to be buying opportunities.
The overall Market sentiment illustrates that the masses are not jumping with joy. The trend is positive, and the Dow Utilities have surged to new highs. Therefore under such conditions, it is hard to envision a crash like a scenario.
Every bull market experiences one back breaking correction that is mistakenly labelled as the beginning of a new bear market. When that occurs, it will be a sign that the end is close at hand. That strong correction will subsequently trigger an even stronger rally and fuel a feeding frenzy. Sentiment will turn bullish, and the masses will dance with Joy, then the bottom will drop. However, we are not at this stage, so there is no point in further developing this story line.
Our ideal setup would call for the Dow to shed 600-1000 points over a very short period; this would drive the masses into the hysteria zone. A small push is all it would take to drive the fear factor through the roof. We all know what happens next; the masses stampede, the smart money swoops in, and history repeats itself once again. For the masses, it is groundhogs day every single day.
A genius can't be forced; nor can you make an ape an alderman. Thomas Somerville
by Sol Palha
Sol Palha is a market analyst and educator who uses Mass Psychology, Technical Analysis and Esoteric Cycles to keep you on the right side of the market. He and his partners are on the web at www.tacticalinvestor.com.
© 2017 Copyright Sol Palha- All Rights Reserved
Disclaimer: The above is a matter of opinion provided for general information purposes only and is not intended as investment advice. Information and analysis above are derived from sources and utilising methods believed to be reliable, but we cannot accept responsibility for any losses you may incur as a result of this analysis. Individuals should consult with their personal financial advisors.
© 2005-2022 http://www.MarketOracle.co.uk - The Market Oracle is a FREE Daily Financial Markets Analysis & Forecasting online publication.


