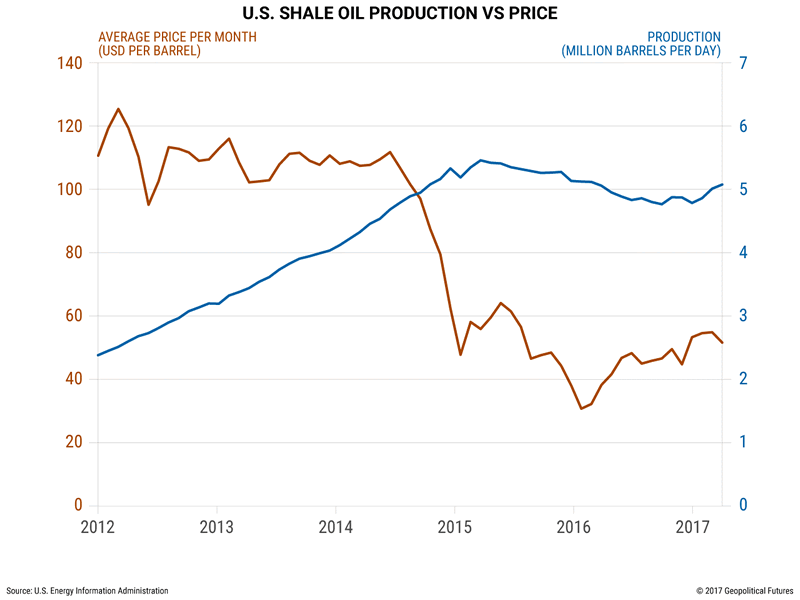
This Chart Proves That Low Oil Prices Can’t Stop US Shale Oil Surge
Commodities / Crude Oil Jun 21, 2017 - 03:27 PM GMTBy: John_Mauldin
By Geopolitical Futures, Mauldin Economics : The US has benefited from the shale revolution more than any other country. Not only does it have vast shale formations, most of its wells are located within its territory. That means producers don’t have to compete for jurisdiction or share their profits.
Shale oil is enmeshed in shale rock, which is located thousands of feet beneath the Earth’s surface and is generally less permeable than other rock types—making deposits more difficult to access.
Oil deposits found in shale rock formations are mainly extracted by way of hydraulic fracturing, also know as fracking. In the 1990s, producers began to combine fracking with a separate process known as horizontal drilling.
The supply of US shale gas, and later shale oil, has increased ever since.

However, in Russia and Saudi Arabia, it’s still much cheaper to drill for conventional oil than for shale oil. Each can produce a barrel for about $10–$15.
With oil priced at $50, the government in Riyadh will make more money off a single barrel than a shale oil driller will for the foreseeable future.
This explains why, even when prices fell so dramatically from 2014 to 2016, OPEC could afford to maintain high levels of production. Its members (and Russia) thought that if they kept prices low and captured market share, they could outlast US shale producers who could, in theory, no longer afford to operate.
It was a sensible strategy at the time. The problem is it didn’t work. OPEC didn’t expect shale oil drillers to lower their costs as much as they did, nor did it anticipate how quickly they could complete unfinished projects.
Plus, a shale oil driller in the United States doesn’t need to be more profitable than Saudi Arabia to drill new wells; the driller just needs to fetch a sufficient return on invested capital.
When prices are low, drillers simply forgo exploration and concentrate on the completed wells that produce enough oil to justify their existence.
Grab George Friedman's Exclusive eBook, The World Explained in Maps
The World Explained in Maps reveals the panorama of geopolitical landscapes influencing today's governments and global financial systems. Don't miss this chance to prepare for the year ahead with the straight facts about every major country’s and region's current geopolitical climate. You won't find political rhetoric or media hype here.
The World Explained in Maps is an essential guide for every investor as 2017 takes shape. Get your copy now—free!
John Mauldin Archive |
© 2005-2022 http://www.MarketOracle.co.uk - The Market Oracle is a FREE Daily Financial Markets Analysis & Forecasting online publication.


