4 Obvious Signs the US Economy Is Stalling—Here’s What to Do
Economics / US Economy Jul 03, 2017 - 04:53 PM GMTBy: John_Mauldin
 BY STEPHEN MCBRIDE : Despite a surge in optimism after the election, nominal GDP growth in 2016 was just 2.95%. This makes 2016 the second-worst year on record since 1959.
And with key economic indicators flashing warnings signs, it looks like the US economy is heading toward big trouble rather than revival.
Here are four signs that paint the picture best.
Credit Demand Is Contracting
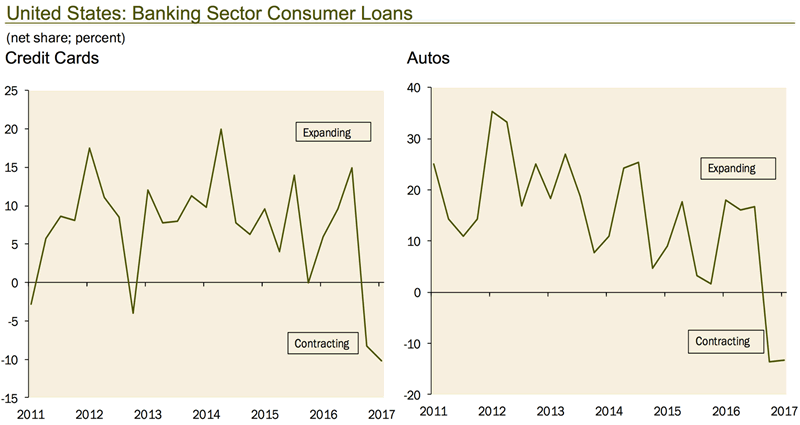
Across all the sectors of bank lending (business, consumer, and real estate), credit demand is falling. The chart below shows a sharp decline in consumer loan growth over the past three quarters.

Source: Haver Analytics, Gluskin Sheff
The pent up demand seems to be exhausted. Given that this economic expansion is now in its ninth year, it’s no surprise.
With consumption accounting for 70% of US economic activity, this will weigh heavily on growth.
Tax Receipts Turn Negative
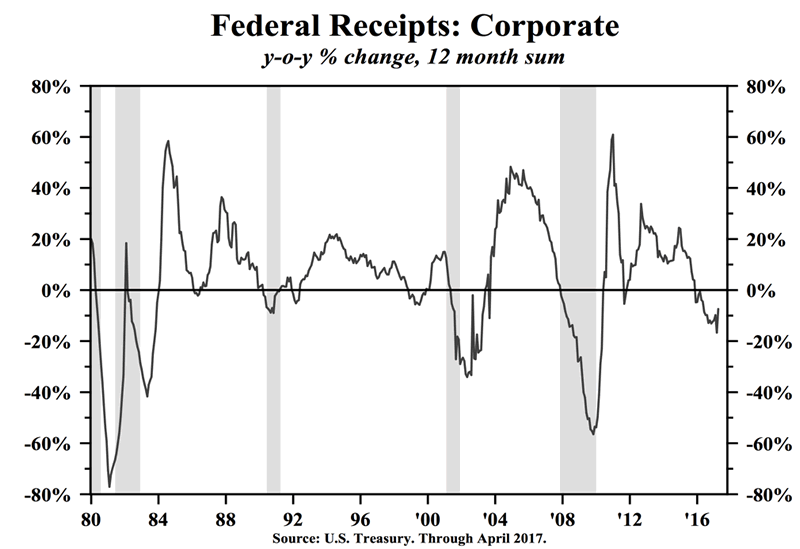
Another indicator that signals the US economy is on a slippery slope is falling corporate tax receipts.
The chart below shows corporate receipts in April contracted most since 2009, when the economy was in midst of the Great Recession.

As Dr. Lacy Hunt, EVP of Hosington Investment Management and former senior economist for the Dallas Fed stated during his SIC 2017 presentation: “This indicator has turned down prior to every post-WWII recession. It suggests that America’s corporations are experiencing a deterioration in earnings.”
The Fed Walks a Tightrope
While consumer demand and economic activity are trending downward, the Fed is tightening monetary policy, which exacerbates the negative effect.
Ten out of the last 13 tightening cycles have ended in recession. In fact, of the 18 recessions since 1913, all but one have been preceded by a tightening cycle.
And here’s why.
Higher interest rates increase the cost of credit, which reduces demand and weighs on economic growth. Dr. Lacy Hunt also made another good point regarding the Fed’s move: “When the Fed tightens, they are saying the economy is doing too well by our standards… we want the economy to have less money and credit growth and we want less economic activity. They are saying this at a time when the best economic indicators are in a downturn.’’
And the bond market seems to agree with Dr. Hunt that the Fed has got it wrong.
A Flattening Yield Curve
The Fed started this tightening cycle in December 2015. But three rate hikes later, the 30-year Treasury—the most economically sensitive Treasury bond—is down by 15 basis points.
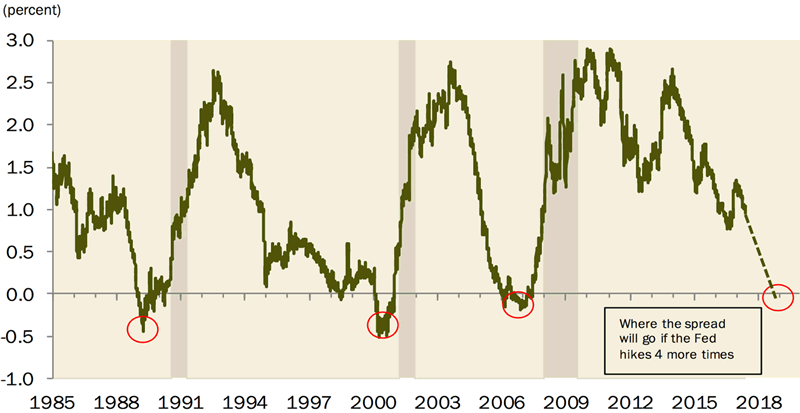
As such, the yield curve has flattened considerably.

Source: Haver Analytics, Gluskin Sheff
A flattening yield curve indicates investors have little confidence in the economy and that the Fed’s tightening cycle is likely to lead to adverse economic consequences. In this scenario, bonds will rise and stocks fall.
Interestingly, if the Fed raises rates four more times, the yield curve would likely invert, which means long-term rates drop below short-term rates. It’s worth noting that the yield curve inverted prior to every recession since 1981.
With all that being said, how should investors position their portfolios today?
How to Invest Around Late-Cycle Themes
At the 2017 Strategic Investment Conference, chief economist and strategist for wealth management firm Gluskin Sheff David Rosenberg said investors should be investing around “late-cycle themes” given the current setup in the markets:
“Investors should be de-risking their portfolios and reducing their exposure to cyclical sectors today. Late-cycle investing means you want to step-up the quality of your portfolio: the ratings and the balance sheets you own.”
Download a Bundle of Exclusive Content from the Sold-Out 2017 Strategic Investment Conference
Get access to exclusive interviews with John Mauldin, Neil Howe and Pippa Malmgren from SIC, an ebook from renowned geopolitical expert George Friedman and bonus SIC 2017 content…
Claim your SIC 2017 bundle now!
John Mauldin Archive |
© 2005-2022 http://www.MarketOracle.co.uk - The Market Oracle is a FREE Daily Financial Markets Analysis & Forecasting online publication.


