Bubble Update: Stocks Are Now at 1999 Bubble Levels (Guess What’s Next)
Stock-Markets / Liquidity Bubble Jul 14, 2017 - 05:20 PM GMTBy: Graham_Summers
Remember the 2007 Bubble?
Remember how everyone said that it really wasn’t that big of a bubble because stocks weren’t as expensive as they had been during the previous bubble (the Tech Bubble).
We all remember how that turned out: the bubble burst leading to the greatest financial crisis in 80 years.
Well, today’s bubble is WAY larger than that of 2007. And arguing that stocks are cheaper than they were during the Tech Bubble doesn’t hold water anymore either.
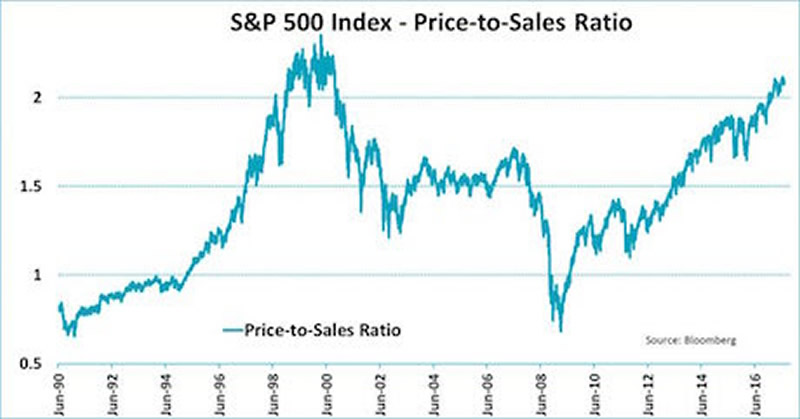
Below is a chart showing the S&P 500’s Price to Sales ratio (also called the P/S ratio). As you can see, based on this metric, the 2007 Bubble is a mere blip. We’re now in territory not seen since the 1999-2000 Bubble.

H/T Jeroen Blokland
Why does this matter?
Earnings, cash flow, and book value are all financial data points that can be massaged via a variety of gimmicks. As a result of this, valuing stocks based on Price to Earnings, Price to Cash Flow, and Price to Book Value can often lead to inaccurate valuations.
Sales on the other hand are all but impossible to gimmick. Either money came in the door, or it didn’t And, if a company is caught faking its sales numbers, someone is going to jail.
So the fact that stocks are now trading at a P/S ratio that matches the Tech Bubble (the single largest stock bubble in history) tells us that we’re truly trading at astronomical levels: levels associated with staggering levels of excess.
What does that mean for stocks?
We’re going to have the 3rd and worst crisis in 20 years.

A Crash is coming…
And smart investors will use it to make literal fortunes.
We offer a FREE investment report outlining when the market will collapse as well as what investments will pay out massive returns to investors when this happens. It’s called Stock Market Crash Survival Guide.
We made 1,000 copies to the general public.
Today is the last day this report will be made available to the public.
To pick up one of the last remaining copies…
Graham Summers
Phoenix Capital Research
http://www.phoenixcapitalmarketing.com
Graham also writes Private Wealth Advisory, a monthly investment advisory focusing on the most lucrative investment opportunities the financial markets have to offer. Graham understands the big picture from both a macro-economic and capital in/outflow perspective. He translates his understanding into finding trends and undervalued investment opportunities months before the markets catch on: the Private Wealth Advisory portfolio has outperformed the S&P 500 three of the last five years, including a 7% return in 2008 vs. a 37% loss for the S&P 500.
Previously, Graham worked as a Senior Financial Analyst covering global markets for several investment firms in the Mid-Atlantic region. He’s lived and performed research in Europe, Asia, the Middle East, and the United States.
© 2017 Copyright Graham Summers - All Rights Reserved Disclaimer: The above is a matter of opinion provided for general information purposes only and is not intended as investment advice. Information and analysis above are derived from sources and utilising methods believed to be reliable, but we cannot accept responsibility for any losses you may incur as a result of this analysis. Individuals should consult with their personal financial advisors.
Graham Summers Archive |
© 2005-2022 http://www.MarketOracle.co.uk - The Market Oracle is a FREE Daily Financial Markets Analysis & Forecasting online publication.


