


Stock & Commodity Markets Elliott Wave Analysis - 25th March 07 - Testing, 1, 2 . . . 3?
Stock-Markets / US Stock Markets Mar 24, 2007 - 08:13 PM GMTBy: Dominick

What a week… again! Once more, the boat was extremely tilted to one side and it had to sink. But not the market, this time it was the bears that really took a soaking. Members of TTC and regular readers of this update, though, continued to bank plenty of profits.
Since the markets broke from the top a few weeks ago, I've insisted on two things. The first was that I wasn't going to label the big picture yet. Even though we were fortunate to be among the few, if not the only ones to navigate last year's rally all the way to the top, I didn't like that drop last month at all – at least not as the start of a bear market. It would have been easy to take a bow, and congratulate myself on a job well done, but I'm always looking for the next trade and I said the fast selloff from 1461 opened doors for alternatives that included new highs AND new lows.
The second thing that I've been stressing lately is that, in my opinion, anyone that “knows” the count going forward is doing nothing but guessing. Lots of alternatives have been possible, but no confirmation of a larger trend. Now, the proof of that is in the charts. The tape was loaded with bears at Wednesday's meeting which were “squeezed” to cover. In other words, I don't think we had a lot of buying Wednesday; the majority of the buying was forced. Besides, smart money buys at the lows. Any trader that was already long the market, especially anyone who came in at our famous SPX 1360 level, did fantastic.
Last week I stated:
Basically, we had a sharp move off the highs in February, then a bounce and a retest. That retest was on Wednesday and we're now moving toward a possible retest of that lower low and should get an explosive move from this area either way that I want you to ride.
Remember that we might see some fake-outs on the way with the Fed meeting on Tuesday and Wednesday next week. The day before the meeting is typically a consolidation period, and could possibly be the consolidation before the big move. But I wouldn't advise you to assume anything before the statement because things will get very interesting if I'm correct about where we are in the pattern. Leave your bias behind or become a victim of the market.
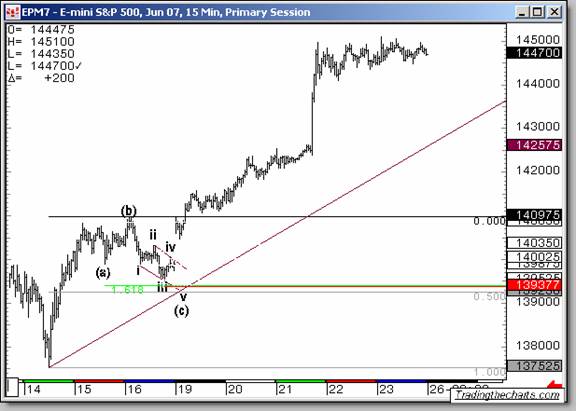
We finished the retest of the retest on Sunday's globex opening. Minutes after it opened down a few points, I posted a chart reiterating my stance, looking to explode from a low of 1394. Globex made a low at 1394.75 only to reverse for a quick twelve points, making the open on the SPX a gap up of eight. Below is the updated chart from that night showing the 1394 target and where we've been since.
But then, I also stated that we should see a consolidation before the Fed meeting and if my idea was correct, that we would explode. Boy did we ever! The problem is that traders like to be in the majority, and the majority was bearish going into the Fed meeting. As the world was tuned into the financial stations to see what a few people would say, my eyes were focused on my screens to see what the majority on the other side of my trade was about to do.
And, no doubt, the concept of “unbiased” Elliott wave triumphed again on Wednesday as everyone that “knew” the count, or what the Fed would have to say, was short and had to cover. But, any of our members who bought 1360 had no problem on Fed day. Anyone buying Sunday's globex session had no problem. Anyone that knew to be flat in front of the meeting had no problem. Only a biased trader had problems.
As stated last week, we were preparing to make an assessment of the Dow soon. I had come up with 3 upside patterns and only 1 down pattern. Along with that, we had historical readings from many things like the TRIN, which is shown below. And don't forget the “trend” charts which I'll show later.
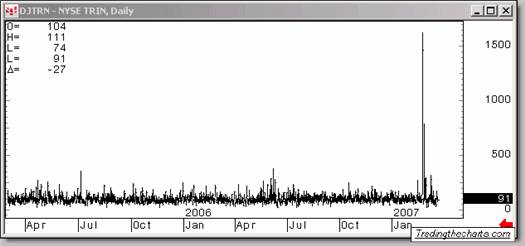
Is that a reading you want to fade? We choose not too. As a matter of fact, one of our noted market observers posted this to the forum AT the lows of 1364:
“When there have been two readings over 2.5 in the same decline, the market never closes lower than the day of the second reading and has always rallied more than it dropped.”
The selling at the March 5 th lows was so off the charts that the only ones in the market were the bears. Funny thing is after Wednesday, I wonder if we have the exact opposite now, or will soon.
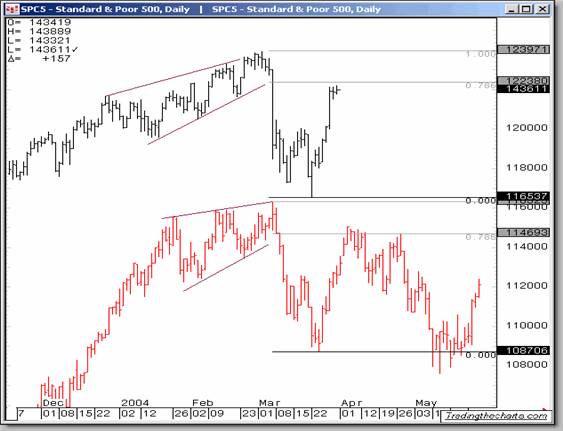
For a while now, I've been posting two analogs in the updates and on the forum. One shows a scenario playing out that is identical to 1946, which should have at least proved to traders that it was not impossible. If you remember last week's update, we've had the “map” for months, and it's still valid as you see in the chart below. Of course, this is always a dangerous trade, and I'll drop it the second I sense it's not working, so don't be selling short anything that might continue up. But so far, we sure can't do any complaining.
From this point on, it will be a big boy's game. If you think the market swings 25 or 50 points a day because of a day trader with a $5000 account, you better think again. This market now means business and I think it's about to show the correct count behind door number 3.
The chart below shows another huge setup we are monitoring. If you remember, I got my confirmation from the gap down in February. And now we're right back up to it. Sure does show you that selling it at the right spot and leaving it on made no sense. We instead became bearish the break in February, traded the hard moves at the lows, and became a serious buyer at 1364. OK, so some did a round trip, no big deal right? Think again. What if sometime next week we gap over the gap, creating an Island reversal? That would really take out the slight bearish case that still exists in the market and at the same time crush the short traders. If that happens, you'll be seeing that capitulation I always talk about.
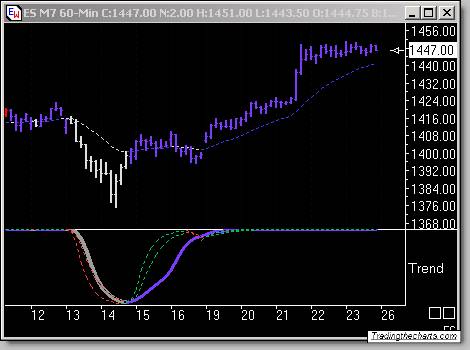
Next week we have some work to do in the short term patterns. We should've already seen a pullback, but the market still has a bid from trapped shorts. My short term trend charts have already weakened, but not the 60 min shown below.
And what a champ this chart has been from the 1364 low! It also shows how anyone looking to it for guidance Pre-Fed, got nothing but bullish suggestions.
Members
I'm glad to have stated last week:
“ Many traders and analyst already have narrowed it down to one pattern. That is far from the truth and I believe that the 4 patterns you will see are all valid.”
Newer members were able to see how we do business. We started with four charts, 3 being bullish! We then got rid of one Pre- fed and I think we know another one has little life in it. This week will give us a lot of information as we wait for the results of this small consolidation. Be sure to see all the charts I posted this weekend as there is a lot of info in them. W ithout giving away the privileges of membership, I will simply caution that once we see the market validate our suspected patterns, we'll be preparing for more violent moves in the future. I will also be cautioning our day traders about going home with positions.
And don't forget that perfectly lined up turn date we have very soon compliments of Leonardo Fibonacci! I also found one in another Major market for April 9 th . Use this link to see that along with the possible retesting of its target area!
To make things line up even nicer, Ray Merriman that has been doing a great job with his work wrote me this…
“My studies, based on geocosmic correlations to cyclical reversals in U.S. stocks, suggest a major top to be completed by April 9, and then a continuation down to the 4-year cycle trough by November, and possibly even by June, to 9700-10,700 in the DJIA. New all-time highs after mid-April may negate this outlook. ”
Raymond Merriman
Editor of "MMA Cycles Report"
www.mmacycles.com
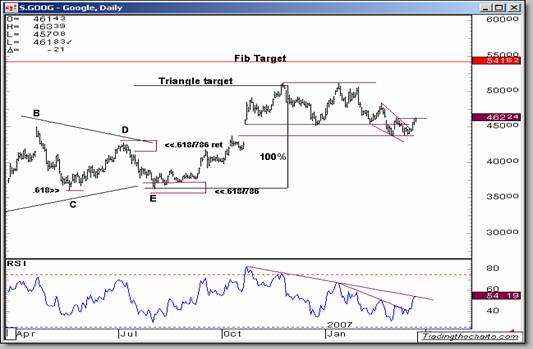
Remember all the fun and profits we had with Google? Well, expect to have some more!
Metals
Finally, be sure to read this week's Precious Points for Joe's take on the very volatile metals markets.
Have a profitable, and safe week trading, and remember:
“Unbiased Elliott Wave works!”
By Dominick
For real-time analysis, become a member for only $50
If you've enjoyed this article, signup for Market Updates , our monthly newsletter, and, for more immediate analysis and market reaction, view my work and the charts exchanged between our seasoned traders in TradingtheCharts forum . Continued success has inspired expansion of the “open access to non subscribers” forums, and our Market Advisory members and I have agreed to post our work in these forums periodically. Explore services from Wall Street's best, including Jim Curry, Tim Ords, Glen Neely, Richard Rhodes, Andre Gratian, Bob Carver, Eric Hadik, Chartsedge, Elliott today, Stock Barometer, Harry Boxer, Mike Paulenoff and others. Try them all, subscribe to the ones that suit your style, and accelerate your trading profits! These forums are on the top of the homepage at Trading the Charts. Market analysts are always welcome to contribute to the Forum or newsletter. Email me @ Dominick@tradingthecharts.com if you have any interest.
© 2005-2022 http://www.MarketOracle.co.uk - The Market Oracle is a FREE Daily Financial Markets Analysis & Forecasting online publication.