


Why Is Home Depot Stock Slumping After Earnings Beat?
Companies / Corporate Earnings Aug 16, 2017 - 01:30 PM GMTBy: Mike_Paulenoff

Home Depot (HD) beat on EPS, Revenues, and Same Store Sales when it reported on Tuesday prior to the market open. However, after initially popping 2.5% to 158.11 from Monday's 154.26 close, HD reversed sharply into negative territory at 153.00/10 in pre-market action and closed the day at 150.17, down 2.6%.
I am not sure what the selling is all about, except for a "sell-the-news" reaction, but one look at my 4-hour chart of HD, we can see that HD actually peaked back in mid-May, and since has established a series of lower-highs (including Tuesday morning's spike to another lower-high).
From a near-term perspective, HD needed to hold support in the 152.40/60 area to avert triggering a potentially significant sell signal from one of a handful of powerful, still relevant and profitable, brick and mortar retailers.
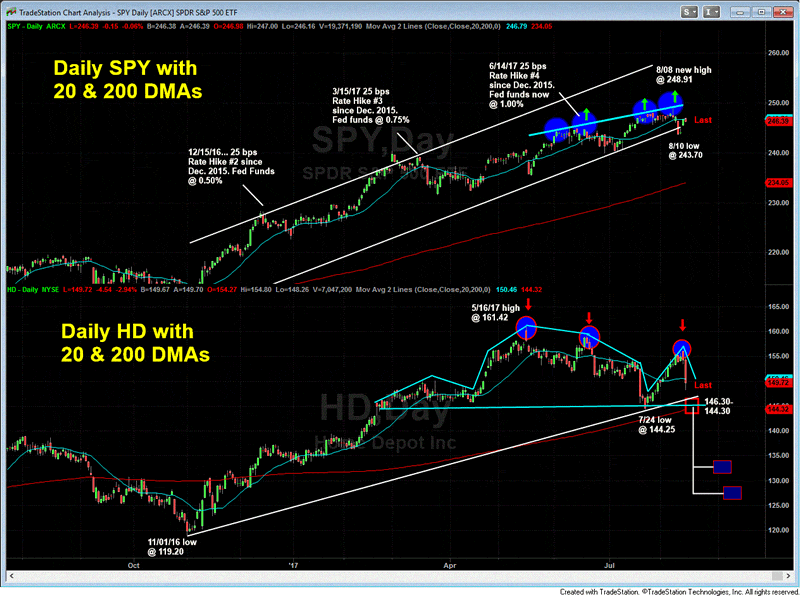
Of course, that level didn't hold, and HD broke that along with its 20-day moving average, now at 150.47, in what increasingly appears to be a developing multi-month top formation on Home Depot that is putting immense price pressure on critical support lodged between 146.30 (the Nov 2016 to Aug 2017 support line) and the most recent meaningful pullback low at 144.25 (July 24, 2017).
Purely from a technical perspective, any forthcoming weakness must be contained above 144.25 to avert triggering downside potential that projects to 134-132, and possibly to 130-125 thereafter.
See our big picture comparison chart of the SPY vs. HD, which illuminates the glaring price divergence between the two names. The glaring under-performance of HD certainly is a drag on the underlying indices like SPY, but also could be a reflection of the health of the consumer (notwithstanding Tuesday morning's strong Retail Sales Report for July), or perhaps some fatigue in the home improvement sector.
All I know is that the pictures of HD and its post-EPS price action are a warning signal about something either macro in scope or indigenous to the company's future growth prospects.
Have a great trading week!
By Mike Paulenoff
Mike Paulenoff is author of www.MPTrader.com, a real-time diary of his technical analysis & trade alerts on ETFs for precious metals, energy, currencies, and an array of equity indices and sectors, including international markets, plus key ETF component stocks in sectors like technology, mining, and banking. Sign up for a Free 15-day Trial!
© 2002-2017 MPTrader.com, an AdviceTrade publication. All rights reserved. Any publication, distribution, retransmission or reproduction of information or data contained on this Web site without written consent from MPTrader is prohibited. See our disclaimer.
Mike Paulenoff Archive |
© 2005-2022 http://www.MarketOracle.co.uk - The Market Oracle is a FREE Daily Financial Markets Analysis & Forecasting online publication.