Stocks do this in October in Years Ending in 7
Stock-Markets / Stock Market 2017 Aug 31, 2017 - 09:41 PM GMTBy: Chris_Vermeulen
 It has been proven repeatedly by various market experts that stock market cycles exist. Whether you believe in them or not that is up to you, but as a technical trader myself I see price action repeat on virtually all time frames from the intraday charts, to daily, weekly, monthly, quarterly, yearly, and beyond.
In fact, cycles tend to move in series of 3’s, 7’s and 10’s, and multiples of these as well. So, 3 bars, 7 bars, 10 bars no matter the time frame, though I find the 10min, daily, weekly, and monthly charts work best.
Knowing these cycles lengths, let’s review briefly where the markets are situated in terms of a seasonality, volatility, and the 3, 7 and 10 cycle periods. What I am about to show you is very intriguing.
I will let the charts do all the talking as they show the picture clearly.
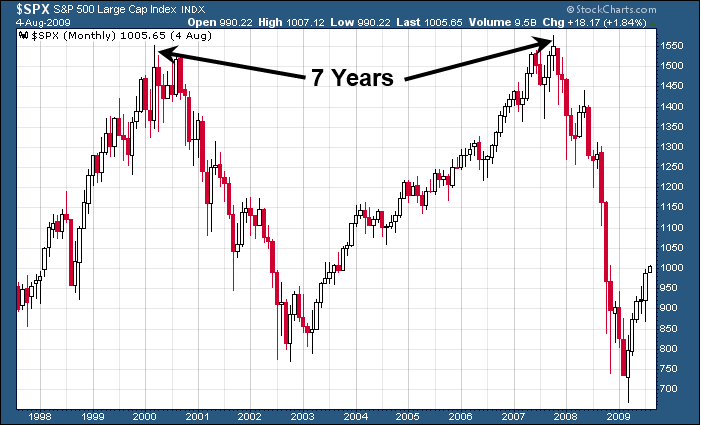
Example of Last 7 Year Stock Market Cycle

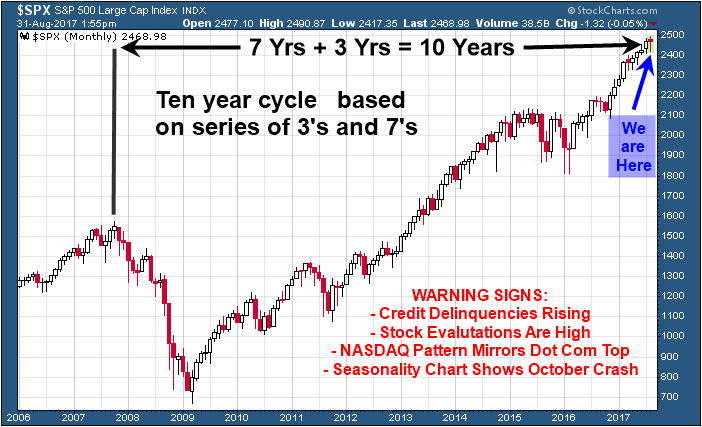
Potential 10 Year Cycle Top Forming

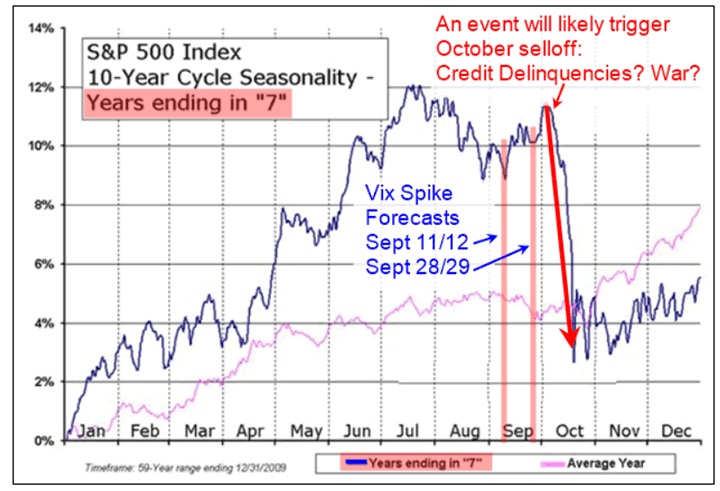
Seasonality of Monthly Price Action for Years Ending in 7

Concluding Thoughts:
In short, this is just a quick snap shot of some angles in which I look at the stock market. There are a lot different things happening (cycles, technical analysis patterns, and fundamentals) which have been painting a bearish picture for the stock market.
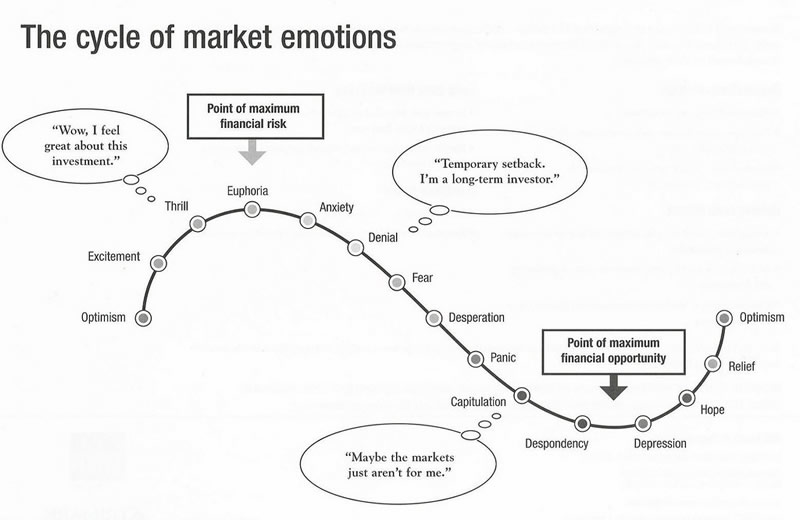
In fact, last year the US equities market were only a couple down days way from trigging a full-blown bear market. But Trump was elected and that triggered a massive rally which I see as being a final exhaustion move (euphoria) just before a major market top.

I have been watching and waiting for what I feel will be the next major market top for just over a year now. Why? Because once a market top looks to be in place we must adjust all our long-term portfolio holdings into different asset classes with CASH being a huge portion of it.
Stock prices typically fall 7 times faster than they rise so just imagine being properly positioned for a bear market with a portion of your position knowing you could make 7 years of slow painful growth in only 8-12 months when the bear market starts. I recently did a seminar talking about his and how one can use inverse ETF’s and short selling to profit from the next financial down turn which will eventually happen.
If you want to stay in the loop and be positioned for this massive move over the next two years Bear Market, then back into a Bull Market be sure to join my 2 Year Trading & Investing newsletter plan at http://www.thegoldandoilguy.com/etf-trading-newsletter/
Chris Vermeulen
www.TheGoldAndOilGuy.com – Daily Market Forecast Video & ETFs
www.ActiveTradingPartners.com – Stock & 3x ETFs
Chris Vermeulen is Founder of the popular trading site TheGoldAndOilGuy.com. There he shares his highly successful, low-risk trading method. For 7 years Chris has been a leader in teaching others to skillfully trade in gold, oil, and silver in both bull and bear markets. Subscribers to his service depend on Chris' uniquely consistent investment opportunities that carry exceptionally low risk and high return.
Disclaimer: Nothing in this report should be construed as a solicitation to buy or sell any securities mentioned. Technical Traders Ltd., its owners and the author of this report are not registered broker-dealers or financial advisors. Before investing in any securities, you should consult with your financial advisor and a registered broker-dealer. Never make an investment based solely on what you read in an online or printed report, including this report, especially if the investment involves a small, thinly-traded company that isn’t well known. Technical Traders Ltd. and the author of this report has been paid by Cardiff Energy Corp. In addition, the author owns shares of Cardiff Energy Corp. and would also benefit from volume and price appreciation of its stock. The information provided here within should not be construed as a financial analysis but rather as an advertisement. The author’s views and opinions regarding the companies featured in reports are his own views and are based on information that he has researched independently and has received, which the author assumes to be reliable. Technical Traders Ltd. and the author of this report do not guarantee the accuracy, completeness, or usefulness of any content of this report, nor its fitness for any particular purpose. Lastly, the author does not guarantee that any of the companies mentioned in the reports will perform as expected, and any comparisons made to other companies may not be valid or come into effect.
Chris Vermeulen Archive |
© 2005-2022 http://www.MarketOracle.co.uk - The Market Oracle is a FREE Daily Financial Markets Analysis & Forecasting online publication.


