


The US Debt Bubble Will Soon Warrant Serious Measures
Interest-Rates / US Debt Sep 15, 2017 - 12:37 PM GMTBy: John_Mauldin

 There is big debate over the exact amount of global debt.
Parts of it get hidden in many out-of-the-way pockets. But broadly speaking, global debt is about 325% of GDP, and likely over $225 trillion as I write.
Global Debt Is Growing Faster Than Global GDP
This chart from McKinsey is almost three years old, but it does show the growth of debt over time, and we know that global debt has grown by about $26 trillion in the last two years.
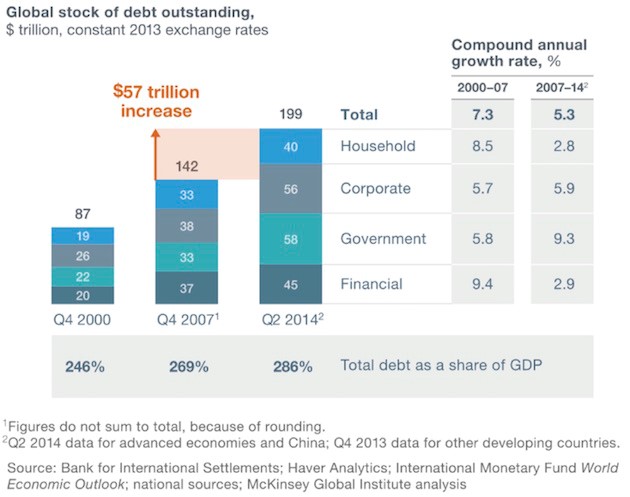
The above chart requires a few observations.
First, notice that the growth of household and financial debt has decelerated. Corporate debt continues to grow at roughly the same pace as before. The real acceleration of growth in debt is coming from government borrowing.
Second, we are on a pace to grow the debt by significantly more between 2014 and 2021 than we did in the previous seven years.
Last, global debt is growing faster than global GDP. We are borrowing money faster than we are creating wealth.
They Lie About Our Deficit—and Our Government Debt Is 115% of GDP
US government debt is about 100% of GDP, or $20 trillion, and growing around $1 trillion a year. Forget what they say when they talk about budget deficits. They lie, because they don’t want to admit what the true deficit is.
However, you can determine the true deficit simply by looking at the amount of money the Treasury has borrowed at the end of the year and see that another $400–$500 billion of "off-budget" debt has been added .
If I ran my regulated investment businesses with the same sort of spurious accounting, the SEC and a raft of other agencies would shut me down faster than you can say “MD&A” and ban me forever from participating in the financial industry.
As they should.
You simply cannot lie when you have a public trust. Well, you can’t unless you are Congress and the government. Then you can pass laws that allow you to lie. But I digress.
To be able to compare our debt to that of other countries, we have to include state and local debt, which is another $3 trillion. That means total US government debt is 115% of GDP.
Japan Now Serves as Our Crystal Ball
That is certainly less than the 250% of debt-to-GDP that Japan finds itself saddled with. But Japan does offer us a clue as to how this will play out.
If you had told me 10 years ago that Japan could essentially monetize well over 100% of their GDP and not have their currency fall through the floor, I would have laughed at you. Since the yen didn’t collapse, we start having to look for other causes and effects.
When the next recession blows in, it will likely balloon the US government deficit up to $2 trillion a year. The Obama administration took eight years to run up a $10 trillion debt after the 2008 recession. It might take just five years after the next recession to amass the next $10 trillion.
Here is a chart my staff created in my free weekly newsletter, Thoughts from the Frontline (subscribe here), using Congressional Budget Office data, that shows what will happen if the next recession comes in 2018 and revenues drop by the same percentage as they did in the last recession (without even counting likely higher expenditures next time).
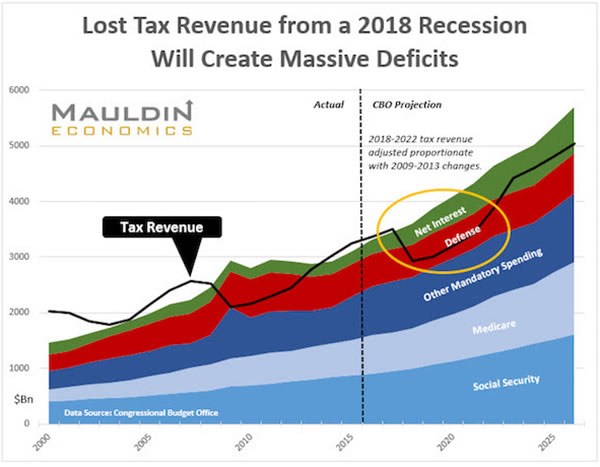
Source: Mauldin Economics
And on top of the $1.3 trillion deficit that this chart predicts, you can add the more than $500 billion in off-budget debt that I mentioned above, plus higher interest rate expense as rates rise.
By the early to mid 2020s, barring substantial increases in taxes or reductions in government benefits and entitlements, the deficit will be approaching $2 trillion annually. There will be weeping and wailing and gnashing of teeth.
If you are in the top 25% of income earners in the United States, you have a big target painted on your income and wealth. The imposition of a VAT seems almost guaranteed. That is the only real way to boost revenues to offset the increases in entitlement spending.
The Republicans don’t want to impose a VAT now as part of major tax reform. But a future Democratic administration and congressional majority will.
Get one of the world’s most widely read investment newsletters… free
Sharp macroeconomic analysis, big market calls, and shrewd predictions are all in a week’s work for visionary thinker and acclaimed financial expert John Mauldin. Since 2001, investors have turned to his Thoughts from the Frontline to be informed about what’s really going on in the economy. Join hundreds of thousands of readers, and get it free in your inbox every week.
John Mauldin Archive |
© 2005-2022 http://www.MarketOracle.co.uk - The Market Oracle is a FREE Daily Financial Markets Analysis & Forecasting online publication.