


Riding the ‘Slide’: Is This What the Next Stocks Bear Market Looks Like?
Stock-Markets / Stocks Bear Market Sep 17, 2017 - 09:03 AM GMTBy: F_F_Wiley

 Even as the Fed’s decision makers are beginning to worry less about recession and more about bubbly stock prices, we’re not yet moved by their attempts to curb the market’s enthusiasm. After all, the fed funds rate sits barely above 1%, which not too long ago qualified as a five-decade low. And other indicators, besides interest rates, aren’t exactly predicting the next bear, either. Inflation is subdued, credit spreads are tight, banks are mostly lending freely and the economy is growing, albeit slowly. It just doesn’t feel as though we’re close to a major market peak.
All that being said, we’re not so much about feelings as we are about delving into history (nerds that we are) and seeing if there’s anything we can learn. Let’s look at the last 90 years to see if any bear markets began under similar conditions to those today.
We’ll consider thirteen bears, as listed in the table below. (Our list may be different to yours, mainly because we use Robert Shiller’s monthly average S&P 500 prices, instead of daily prices, but also because we reset the cycle whenever the market falls 20% from a peak or rises 20% from a trough.)
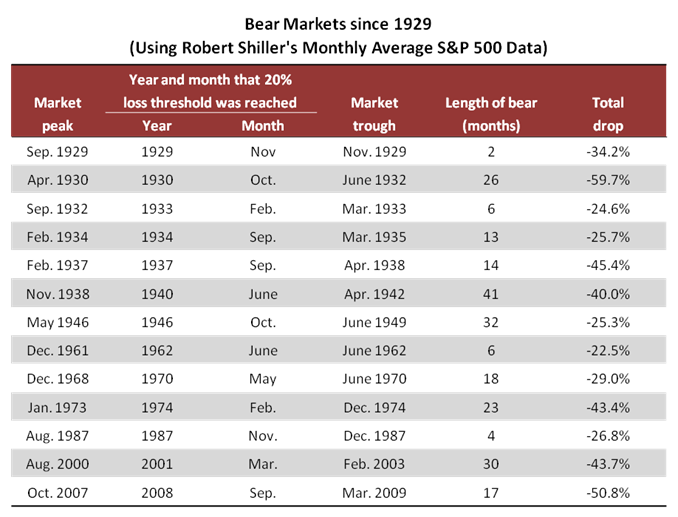
Next we narrow the list by excluding bears that began during recessions, because we don’t think the economy is recessing as I write this (or recessing imminently—see here.) That removes the first three bears—those that began in 1929, 1930 and 1932. Every other bear began as the economy was expanding, which explains why market peaks are so difficult to predict.
We also exclude the bear that crossed the 20% threshold in June 1940 and can’t be separated from geopolitics. Hopefully, modern geopolitical risks won’t explode as they did then, but we can always return to the “WWII bear” if WWIII breaks out (presuming we’re alive and blogging).
After the exclusions, nine bears remain. We examine each one to determine how many were predicted by rising inflation, one of the strongest bear-market indicators. Rising inflation erodes purchasing power, invites monetary restraint and unsettles both lenders and investors. Judging by the next chart, it helped trigger at least seven of the nine bears:
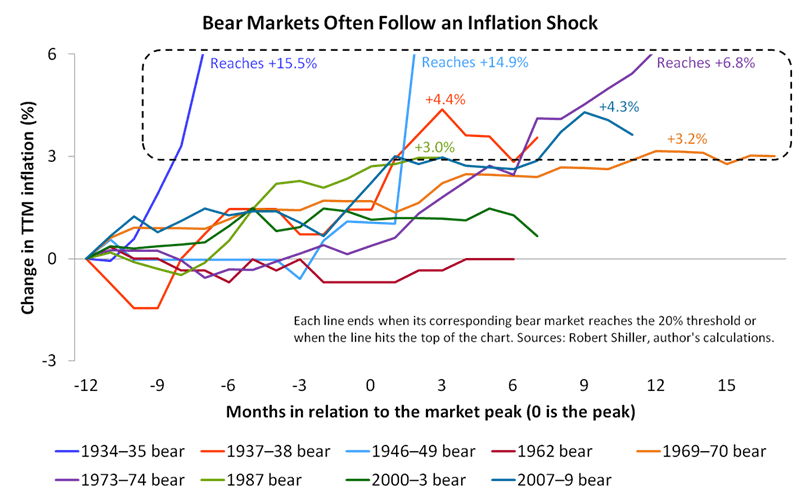
The chart shows seven bears emerging from an inflation “shock” of 3% or more (referring to an increase from twelve months before a market peak to when stocks reached the bear market threshold of –20%). In each of those cases, it seems pointless to attempt to draw parallels to today. Inflation is currently below 2% and down almost a percent from January. Without an inflation shock in sight, we shouldn’t rely on the seven “inflation bears” to predict the future.
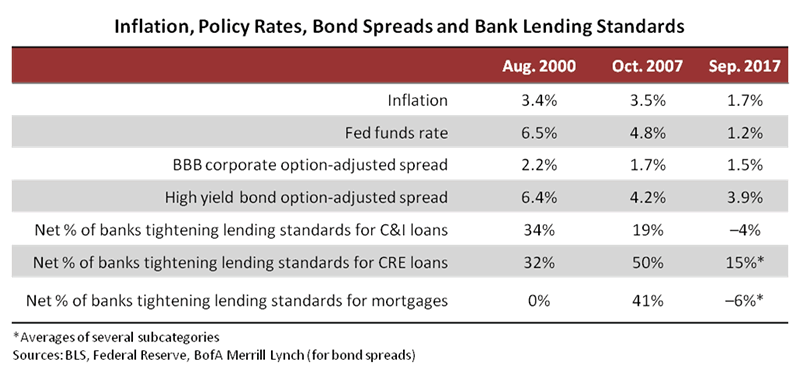
That leaves two bears we haven’t yet considered. In one of the two—the bear that began in August 2000—inflation contributed to the market’s reversal, but monetary policy and credit conditions were more telling. Policy rates rose, credit spreads widened and bank lending standards tightened—all before the market peak. Market conditions at that time were quite different to those today, as shown in the table below (which also includes the October 2007 peak for added context):
In other words, twelve of the original thirteen bears emerged from some combination of recession, inflation, world war, monetary tightening, and troubles in credit markets. In each case, market conditions were uglier than they appear now. The twelve bears tell us to be optimistic—they’ll continue to hibernate until conditions worsen. But we’ve yet to consider the 1962 bear, which finally supplies a potential match for today.
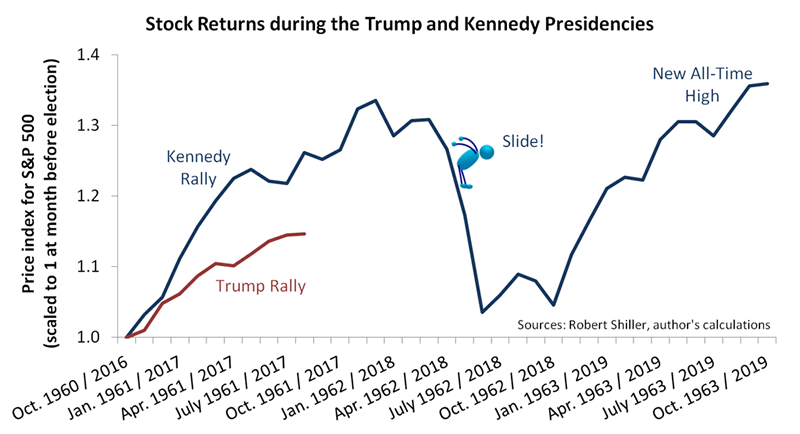
The lead-up to the 1962 bear looks eerily similar to 2017. Commentators called it the Kennedy Slide. Before the Slide, the market hadn’t fallen 20% on a month-average basis since 1946. And the bull gathered speed after JFK won the presidency. Sound familiar? Here’s a chart comparing the S&P 500 (SPY) in the three years after Kennedy’s election to the first ten months after Donald Trump’s election (there’s a joke somewhere in the respective trajectories, but we would like to keep our G rating):
Conclusions
The Kennedy Slide offers a reasonable guide to how a future bear could develop if key indicators remain benign. Consider that the Slide defied four fundamentals you wouldn’t normally associate with falling stock prices:
- Inflation was subdued, peaking at 1.3%.
- Monetary policy was close to neutral, with the discount rate at 3%.
- Growth was strong, reaching 7.4% in Q1 1962 and 4.4% in Q2, after Q4/Q4 growth of 6.4% in 1961.
- Credit spreads were testing 18-month lows of just above 1% (for the Moody’s Baa Corporate versus the 10-year Treasury).
Surely those cozy fundamentals explain the market’s rocket-fast recovery. Stocks reached a new all-time high in September 1963, just 21 months after the prior high. That’s the shortest period on record from one all-time high through a bear market to the next all-time high—faster even than the recovery from the 1987 crash.
And what might 1962 tell us about the future?
Well, as of now, inflation, monetary policy, growth and credit are only marginally less cozy than they were then. If that continues, we would bet on a rapid recovery from a Trump Slide, should one occur. But it’s important for inflation, monetary policy, growth and credit to remain nonthreatening. Any of those fundamentals could change rapidly, and they tend to correlate. (We expect monetary policy to be a particular risk within a couple of years, as discussed here.) Should the four fundamentals deteriorate, we would ignore the 1962 bear and turn to other bears for clues about what happens next. Considering the unprecedented period of monetary stimulus, we would then expect an ill-tempered bear, one that might resemble the bears that began in 1930, 2000 and 2007.
When we pass the next market peak, in other words, four key fundamentals should tell us whether we’ll “ride the slide” or experience something much worse.
F.F. Wiley
F.F. Wiley is a professional name for an experienced asset manager whose work has been included in the CFA program and featured in academic journals and other industry publications. He has advised and managed money for large institutions, sovereigns, wealthy individuals and financial advisors.
© 2017 Copyright F.F. Wiley - All Rights Reserved
Disclaimer: The above is a matter of opinion provided for general information purposes only and is not intended as investment advice. Information and analysis above are derived from sources and utilising methods believed to be reliable, but we cannot accept responsibility for any losses you may incur as a result of this analysis. Individuals should consult with their personal financial advisors.
© 2005-2022 http://www.MarketOracle.co.uk - The Market Oracle is a FREE Daily Financial Markets Analysis & Forecasting online publication.