


Inflation Lies, Lies and OMG More Lies
Economics / Inflation Sep 18, 2017 - 12:37 PM GMTBy: James_Quinn

 “There are three types of lies — lies, damn lies, and statistics.” – Benjamin Disraeli
Every month the government apparatchiks at the Bureau of Lies and Scams (BLS) dutifully announces inflation is still running below 2%. Janet Yellen then gives a speech where she notes her concern inflation is too low and she needs to keep interest rates near zero to save humanity from the scourge of too low inflation. I don’t know how I could survive without 2% inflation reducing my purchasing power.
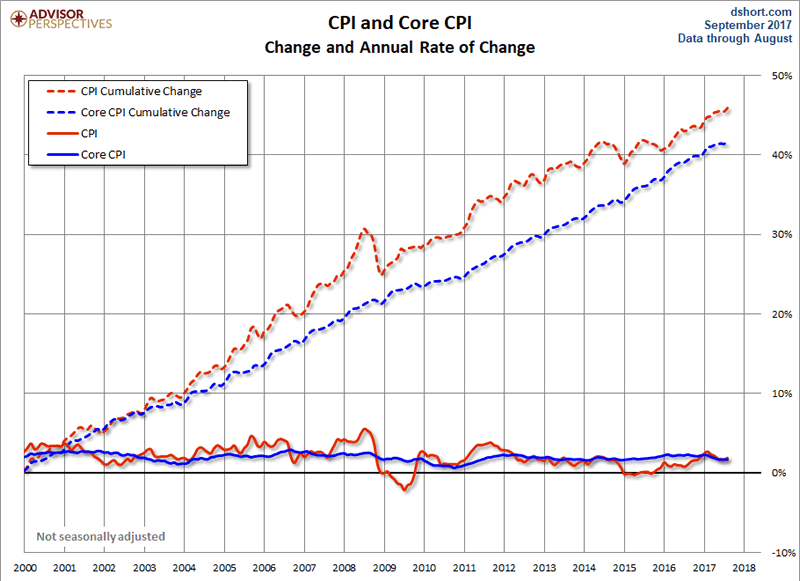
This week they reported year over year inflation of 1.9%. Just right to keep Janet from raising rates and keeping the stock market on track for new record highs. According to our beloved bureaucrats, after they have sliced, diced, massaged and manipulated the data, you’ve experienced annual inflation of 2.1% since 2000. If you believe that, I’ve got a great real estate deal for you in North Korea on the border with South Korea.
“Lies sound like facts to those who’ve been conditioned to mis-recognize the truth.” ― DaShanne Stokes
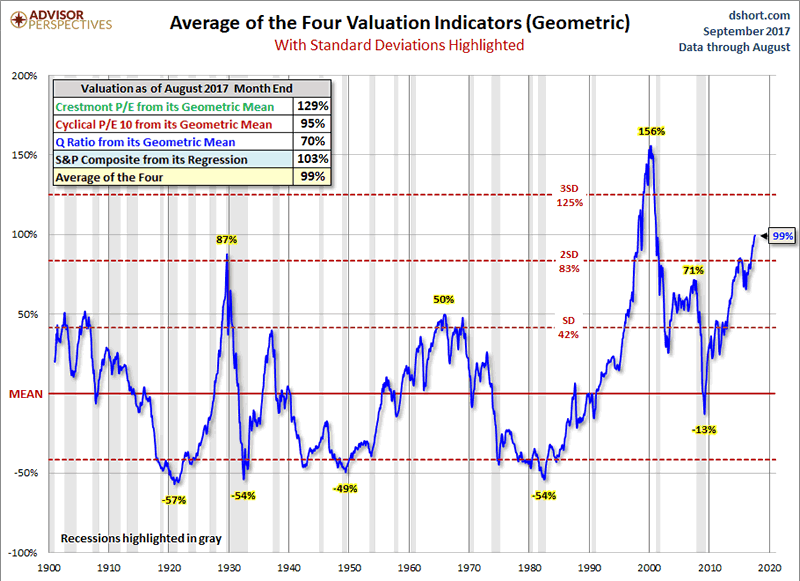
Ignore that silly Shiller PE ratio far surpassing 1929 and 2007 levels. Ignore every historically accurate valuation method showing the stock market 70% to 129% overvalued. Wall Street shysters like Jamie Dimon, faux financial analysts, corporate media talking heads and even Donald Trump tell you this time is different. Tax cuts, amnesty for illegals, more wars, and eliminating the debt ceiling will surely spur massive economic growth. Trillion dollar deficits are always bullish. Making America Great with More Debt should drive the stock market to 30,000 in no time.
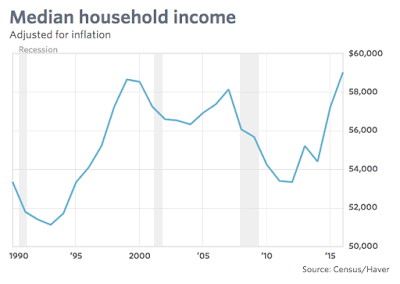
All is well. Real median household income just surpassed the level achieved in 1999. Think about that for a second. It took seventeen years for the average American family to get back to a household income of $59,000. The $59,000 of household income in 2017 doesn’t quite go as far as it did in 1999, with even BLS manipulated inflation showing an 87% increase in medical costs, 80% increase in energy costs, 51% increase in food costs, 53% increase in housing costs, and a 115% increase in college education. And of course the BLS changed their methodology, boosting household income by $1,700 in 2013. So, in reality it is still below 1999 levels.
When you consider 50% of all households make less than $59,000, have not benefited one iota from the Fed/Wall Street debt engineered stock bull market, have less than $1,000 in savings, and less than $50,000 of retirement savings, you realize your Deep State masters must propagandize economic data and manipulate inflation and unemployment figures to keep the masses confused, deluded, and misinformed. The Big Lie is their strategy of choice.
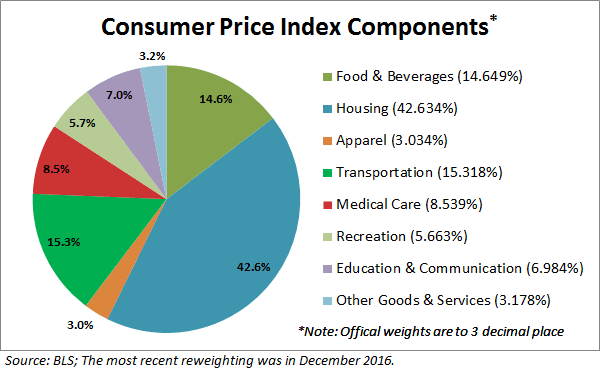
The lies built into the politically motivated CPI figure are designed to screw senior citizens, bond investors, and average hard working Americans who depend upon annual salary increases to keep their heads above water. Corporations are able to point to the low levels of CPI as the reason they don’t need to provide higher salary increases. The government can get away with providing little or no Social Security increases to senior citizens by purposely under-reporting inflation based upon academic theories put forth by captured Ivy League pinheads paid off by the Deep State.
The chart below provides the government reported cumulative increases in key categories since 2000. Not only does the government purposely under-report the increases in these costs, they also purposely under-weight the significance of particular categories in order to reduce the reported level of inflation. Some of these categories show significant increases, but they are far lower than what average Americans are actually experiencing in the real world.
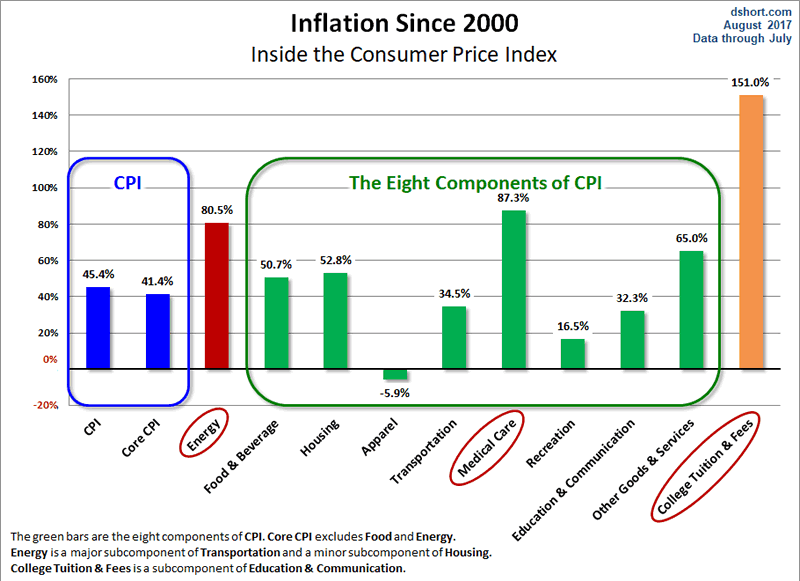
One of the outrageous examples of how the government uses academic gibberish about product improvements to drastically under-report CPI is how they report new vehicle inflation. The average price of a new car in 2000 was $22,000. Today, the average price is $34,500. That’s a 57% increase. The BLS bullshit artists have the gall to report new vehicle inflation of a whopping 2% since 2000.
They have “adjusted” away 55% of the actual increase by saying airbags and other unnecessary technological baubles improved automobiles to such an extent, prices didn’t really go up. What a ***** joke. Having your ass warmed with the push of a button didn’t put the extra $12,500 in your bank account to pay for that car. And new vehicles account for 3.6% of the CPI calculation, while health insurance accounts for 1% of the weighting. Yeah, that reflects reality.
Another outrageous example of under-reporting inflation is in the highest weighted category of housing. It is supposed to reflect the cost of rent and home ownership. The owners equivalent rent calculation is purposely opaque in order to suppress the true cost increase. Median home prices were $165,000 in 2000 and are currently $317,000, a 92% increase. The average rent of $475 in 2000 has risen to $910 today, also a 92% increase. So it makes total sense for the BLS drones to report a 53% increase in housing since 2000. I’m sure their academic model adjusted the true increase downward by 39% due to some obscure algorithm created by a Princeton economics professor.
Medical care advancing by 87% since 2000 sounds substantial, but that only equates to annual inflation of 3.5%. I’d love to find anyone in this country who has only seen their medical costs rise by 3.5% per year. The blatantly shameful falsification of medical inflation is evident to anyone living through the current Obamacare nightmare. According to these BLS prevaricators, health insurance has only risen by 21% since the passage of the Obamacare abortion bill. That lie is beyond comprehension as anyone living in the real world has likely experienced insurance premium increases exceeding 100% since 2009.
I work for the largest employer in Philadelphia, with the most leverage in negotiating insurance premiums with the health insurance complex. I also have tracked my expenditures by category since the 1990’s with Quicken. I know exactly what my medical costs and health insurance costs were in 2009 and what they are today. Let’s do a reality check on the BLS inflation figures of 26% for medical services and 21% for health insurance premiums.
Back in 2009 we had no individual or family deductibles, no co-pays for lab work, and low co-pays for doctor visits. Today, with $1,500 individual deductibles and co-pays 70% higher, our annual medical expenses are 140% higher than they were in 2009, with one less person in the house. That’s slightly more than the BLS fraudulent figure of 26%. Our annual health insurance premiums aren’t 21% higher than 2009. They are 90% higher. And I work for an employer that has negotiating leverage. Many Americans are experiencing 200% to 400% increases. This is the real world, not some excel spreadsheet model world created by academics, politicians and bureaucrats.
Could the BLS be as incompetent in capturing medical inflation as they appear or are they massively under-reporting the true inflation and the weighting for the average American family on purpose? I would contend it is purposeful and directed by those in power as a last ditch effort to keep the masses from revolting and hanging them from the nearest lamppost. The Federal Reserve and their Deep State co-conspirators must massively understate true inflation because reporting the truth would require interest rates to be raised, Social Security payments to be increased, and wages to be elevated – blowing a gaping hole in the federal budget and initiating a stock, bond and housing market collapse.
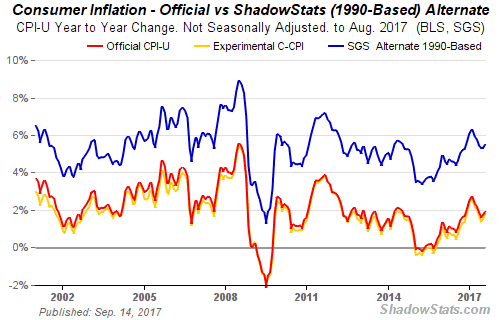
Those in power know their decades of propaganda and social engineering in public schools have dumbed down the masses to such an extent not one in ten could even tell you what CPI stands for, let alone how it is measured. Any critical thinking intelligent person aware of their daily costs knows their true annual inflation rate isn’t 1.9%. It exceeds 5% and has exceeded 5% since 2000. Anyone reading and understanding this article is a dangerous man to the government. We know they are dishonest, insane and intolerable. Our job is to spread discontent until a tipping point is reached. I don’t think we are too far away.
“The most dangerous man to any government is the man who is able to think things out for himself, without regard to the prevailing superstitions and taboos. Almost inevitably he comes to the conclusion that the government he lives under is dishonest, insane and intolerable, and so, if he is romantic, he tries to change it. And even if he is not romantic personally he is very apt to spread discontent among those who are.” ― H.L. Mencken
Join me at www.TheBurningPlatform.com to discuss truth and the future of our country.By James Quinn
James Quinn is a senior director of strategic planning for a major university. James has held financial positions with a retailer, homebuilder and university in his 22-year career. Those positions included treasurer, controller, and head of strategic planning. He is married with three boys and is writing these articles because he cares about their future. He earned a BS in accounting from Drexel University and an MBA from Villanova University. He is a certified public accountant and a certified cash manager.
These articles reflect the personal views of James Quinn. They do not necessarily represent the views of his employer, and are not sponsored or endorsed by his employer.
© 2017 Copyright James Quinn - All Rights Reserved
Disclaimer: The above is a matter of opinion provided for general information purposes only and is not intended as investment advice. Information and analysis above are derived from sources and utilising methods believed to be reliable, but we cannot accept responsibility for any losses you may incur as a result of this analysis. Individuals should consult with their personal financial advisors.
James Quinn Archive |
© 2005-2022 http://www.MarketOracle.co.uk - The Market Oracle is a FREE Daily Financial Markets Analysis & Forecasting online publication.