


USD/CHF – Verification of Breakout or Further Declines?
Currencies / Forex Trading Sep 19, 2017 - 03:13 PM GMTBy: Nadia_Simmons

 At the end of the previous week, the greenback moved lower against the Swiss franc, which resulted in a comeback to the previously-broken support/resistance line. Will we see a verification of the earlier breakout or rather further declines in the coming week?
EUR/USD
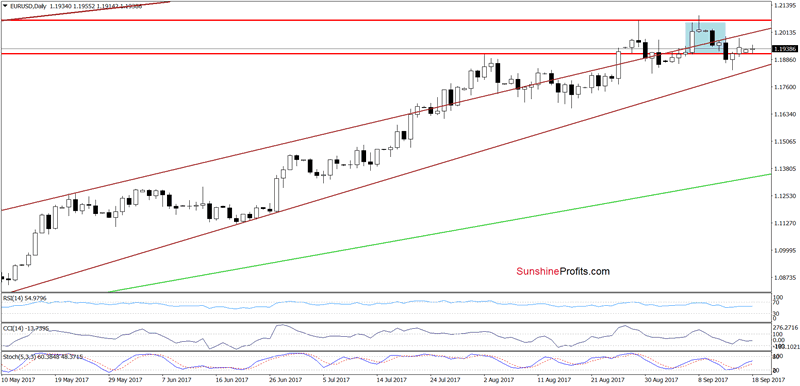
Looking at the daily chart, we see that the overall situation hasn’t changed much as EUR/USD is still trading under the upper border of the brown rising trend channel.
Will the broader perspective give us more clues about future moves? Let’s check.
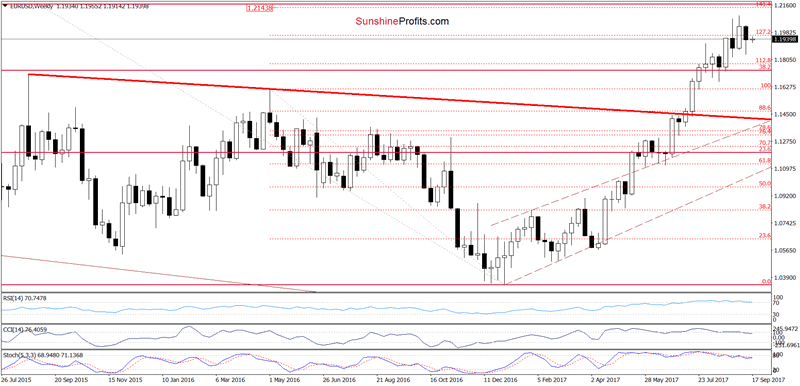
From the medium-term perspective, we see that EUR/USD closed the previous week under the 127.2% Fibonacci extension, which means an invalidation of the earlier breakout above this resistance. Taking this negative development and the sell signals generated by the weekly indicators, we think that further deterioration is just around the corner – especially when we factor in the current situation in the long-term perspective.
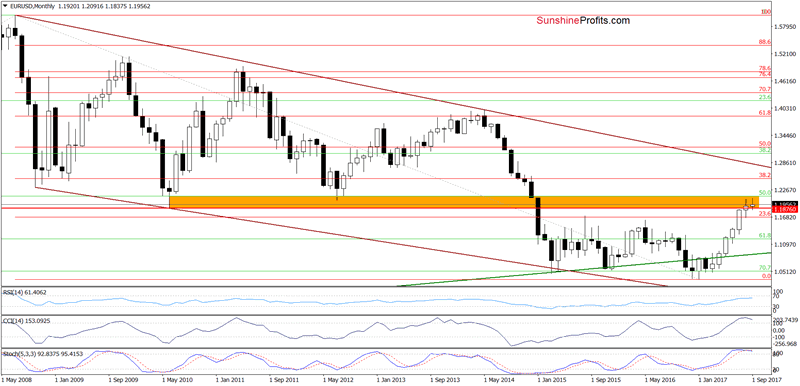
On the monthly chart, we see that EUR/USD is still trading in the orange resistance zone. Additionally, indicators increased to the highest levels since April 2014. Back then, such high readings of the CCI and Stochastic Oscillator preceded bigger move to the downside, which suggests that we may see a similar price action in the coming week(s).
USD/CAD
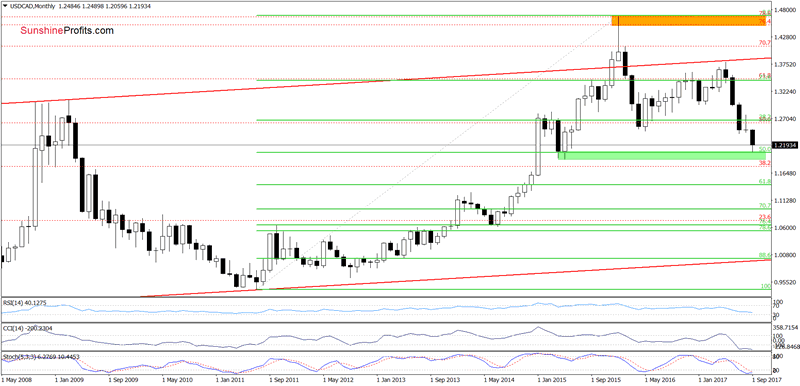
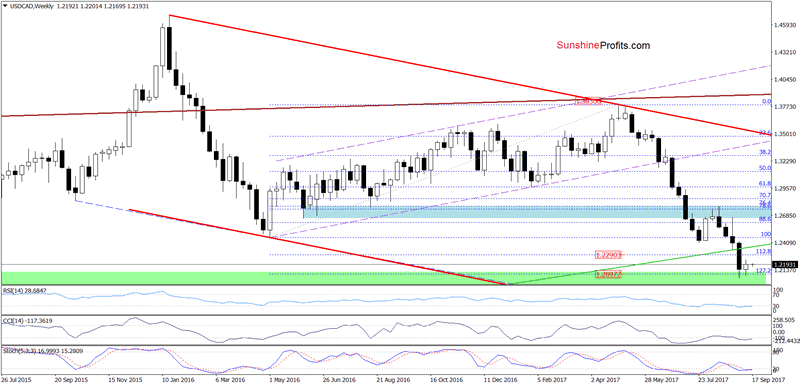
Looking at the above charts, we see that the upper border of the green support zone (created by the 127.2% Fibonacci extension) together with the 50% Fibonacci retracement (based on the entire 2011-2016 upward move and marked on the long-term chart) continue to keep declines in check. But will we see further improvement in the coming week? Let’s examine the daily chart and find out.
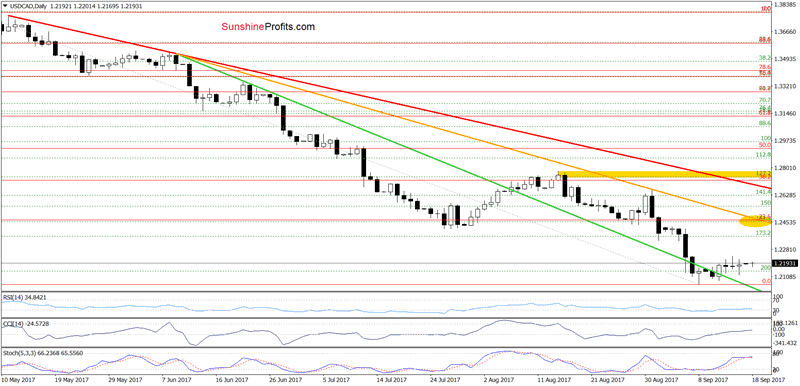
From the very short-term perspective, we see that USD/CAD is still trading above the green support line and the 200% Fibonacci extension, which together with buy signals generated by the daily indicators suggests further improvement.
If this is the case and the exchange rate extends gains from current levels, we’ll likely see an increase to the resistance area (marked with the yellow ellipse) created by the 23.6% Fibonacci retracement (based on the entire May-September downward move), the orange declining resistance line and the July lows in the coming days.
USD/CHF
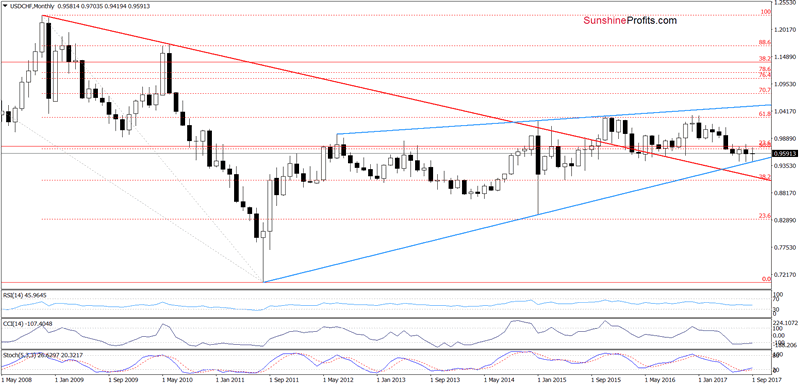
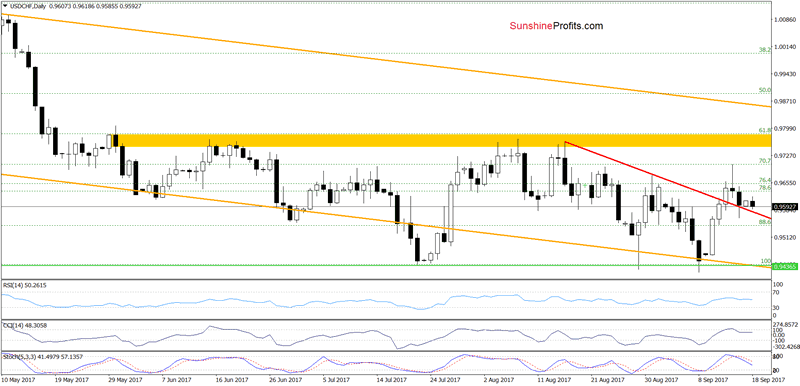
From today’s point of view, we see that although USD/CHF broke above the red declining resistance line based on the previous highs, currency bears stopped further improvement and the exchange rate didn’t even reach the yellow resistance zone. This show of bulls’ weakness triggered a pullback which took USDCHF to the previously-broken red line. Such price action could be a verification of the earlier breakout, but taking into account the sell signals generated by the indicators, it seems to us that that lower values of the exchange rate should not surprise us in the coming week. Therefore, if USD/CHF closes one of this week sessions below the red support line, we could even see a re-test of the long-term blue support line in the following days.
If you enjoyed the above analysis and would like to receive free follow-ups, we encourage you to sign up for our daily newsletter – it’s free and if you don’t like it, you can unsubscribe with just 2 clicks. If you sign up today, you’ll also get 7 days of free access to our premium daily Oil Trading Alerts as well as Gold & Silver Trading Alerts. Sign up now.
Nadia Simmons
Forex & Oil Trading Strategist
Przemyslaw Radomski
Founder, Editor-in-chief
Sunshine Profits: Gold & Silver, Forex, Bitcoin, Crude Oil & Stocks
Stay updated: sign up for our free mailing list today
* * * * *
Disclaimer
All essays, research and information found above represent analyses and opinions of Nadia Simmons and Sunshine Profits' associates only. As such, it may prove wrong and be a subject to change without notice. Opinions and analyses were based on data available to authors of respective essays at the time of writing. Although the information provided above is based on careful research and sources that are believed to be accurate, Nadia Simmons and his associates do not guarantee the accuracy or thoroughness of the data or information reported. The opinions published above are neither an offer nor a recommendation to purchase or sell any securities. Nadia Simmons is not a Registered Securities Advisor. By reading Nadia Simmons’ reports you fully agree that he will not be held responsible or liable for any decisions you make regarding any information provided in these reports. Investing, trading and speculation in any financial markets may involve high risk of loss. Nadia Simmons, Sunshine Profits' employees and affiliates as well as members of their families may have a short or long position in any securities, including those mentioned in any of the reports or essays, and may make additional purchases and/or sales of those securities without notice.
© 2005-2022 http://www.MarketOracle.co.uk - The Market Oracle is a FREE Daily Financial Markets Analysis & Forecasting online publication.