


AUDUSD Broke Below Trend Line Support At 0.7975
Currencies / Austrailia Sep 20, 2017 - 02:53 PM GMTBy: Franco_Shao

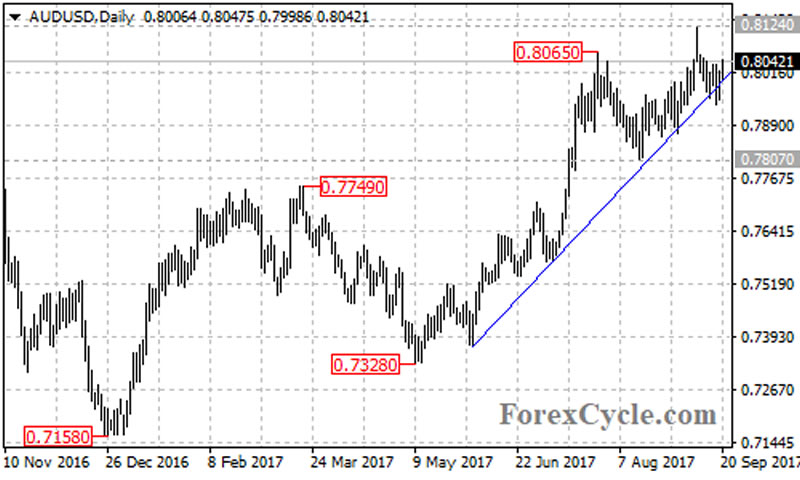
 After failing in its two attempts to break above the resistance of the May 2015 high of 0.8162, AUDUSD pulled back from 0.8124 and broke below a major support trend line at 0.7975 on its daily chart, suggesting that lengthier consolidation for the uptrend from 0.7328 is underway.
On the downside
The AUDUSD pair also broke below the bottom support trend line of a price channel on its 4-hour chart, indicating that the price is now in short term downtrend from 0.8124. Near term resistance is at 0.8050, as long as this level holds, the downside movement could be expected to continue and a breakdown below 0.7939 support could trigger another fall towards 0.7871, followed by 0.7807.
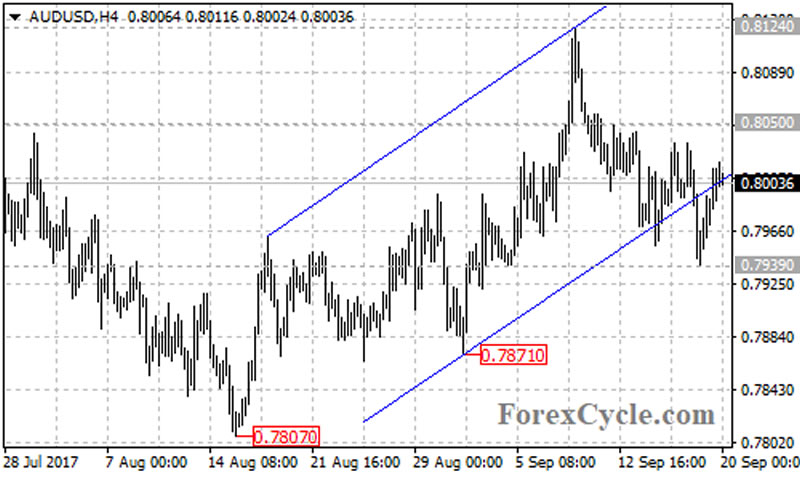
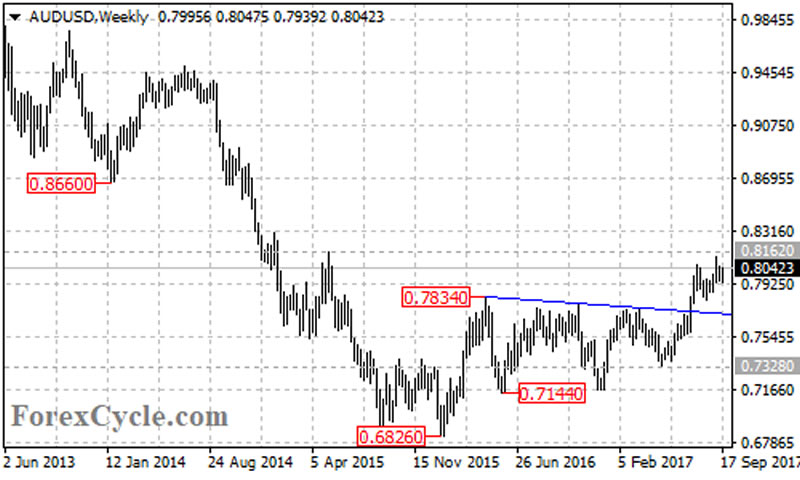
The 0.7807 level could be treated as the key support of the uptrend from 0.7328. A breakdown below this level could confirm that the uptrend had completed at 0.8124 already, then the pair would find next important support at the resistance-turned-support trend line on the weekly chart, now at around 0.7700. Below this trend line could signal completion of the whole uptrend from 0.6826, then the following downside movement could bring price back towards 0.6826.
On the upside
If the near term resistance at 0.8050 gives way, the AUDUSD pair would extend higher to retest 0.8162 resistance. An upside break of 0.8162 resistance could take price to the 38.2% Fibonacci retracement taken from the July 2011 high of 1.1080 to the January 2016 low of 0.6826 at 0.8450.
Technical levels
Support levels: 0.7939 (near term support), 0.7871 (the August 31 low), 0.7807 (the August 15 low), 0.7700 (the resistance-turned-support trend line on the weekly chart), 0.7328 (the May 9 low), 0.7144 (the May 2016 low), 0.6826 (the January 2016 low).
Resistance levels: 0.8050 (near term resistance), 0.8124 (the September 8 high), 0.8162 (the May 2015 high), 0.8450 (the 38.2% Fibonacci retracement).
This article is written by Franco Shao, a senior analyst at ForexCycle.
© 2017 Copyright Franco Shao - All Rights Reserved Disclaimer: The above is a matter of opinion provided for general information purposes only and is not intended as investment advice. Information and analysis above are derived from sources and utilising methods believed to be reliable, but we cannot accept responsibility for any losses you may incur as a result of this analysis. Individuals should consult with their personal financial advisors.
© 2005-2022 http://www.MarketOracle.co.uk - The Market Oracle is a FREE Daily Financial Markets Analysis & Forecasting online publication.