USDJPY Leads the way for a Resurgent Greenback
Stock-Markets / Financial Markets 2017 Sep 22, 2017 - 10:29 AM GMTBy: Enda_Glynn
 A very good evening to one and all.
Despite a shock to the system last night,
the sharp USD rally has not invalidated any of the operating wave counts.
Although it is a picture of what is to come for the USD in the near future,
The short term wave counts are pointing to one last push up before completing the larger structures.
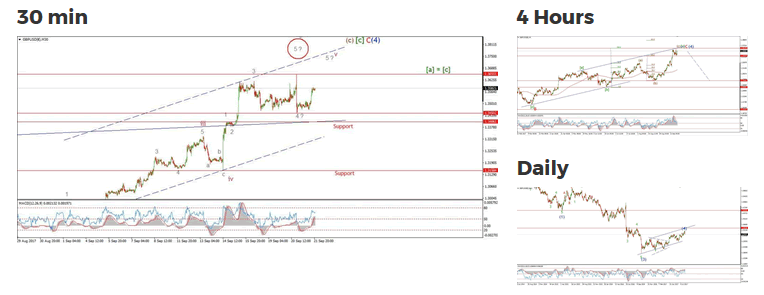
GBPUSD

My Bias: short below parity in wave (5).
Wave Structure: continuing impulsive structure to the downside in wave (5)
Long term wave count: decline in wave (5) blue, below parity
Important risk events: GBP: Prime Minister May Speaks. USD: N/A.
Cable is showing more strength today after a a slight new low last night.
Wave '4' grey seems to have traced out an expanded flat correction
and wave '5' grey is now likely underway
with a target at 1.3700 to complete wave 'v' pink.
Key support in the short term is at the high of wave '1' grey.
So 1.3406 is the level to watch as a short term invalidation point.
If this level breaks, it is likely that the market has topped out.
The 4hr chart shows a bearish momentum divergence right now,
So this rally could end quickly.
For tomorrow;
watch for 1.3450 to hold and wave 'v' to reach the upper trend line one last time.
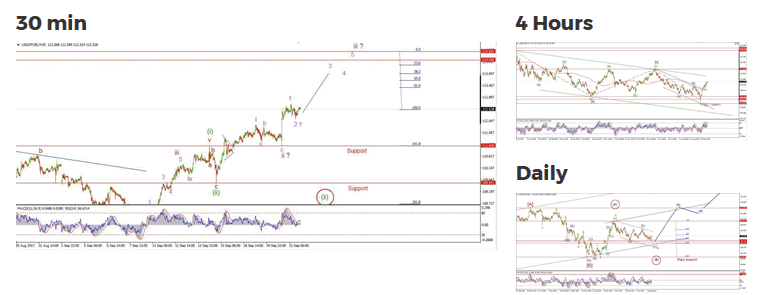
USDJPY

My Bias: LONG
Wave Structure: rally in wave [C]
Long term wave count: wave [C] is underway, upside to above 136.00
Important risk events: JPY: N/A. USD: N/A.
USDJPY held on to most of its recent gains today.
Even the short term decline off the todays high at 112.71
looks to be in a corrective three wave form.
I have labelled the current structure in the most bullish fashion.
With waves 1,2 pink complete and wave '3' pink underway.
Key support lies at the wave 'ii' brown low of 111.04.
The price should not break as wave 'iii' brown develops.
For tomorrow;
The low of the session was at 112.13,
Watch for that level to hold in wave '2' pink.
Wave '3' should carry price higher into the high 113 range.
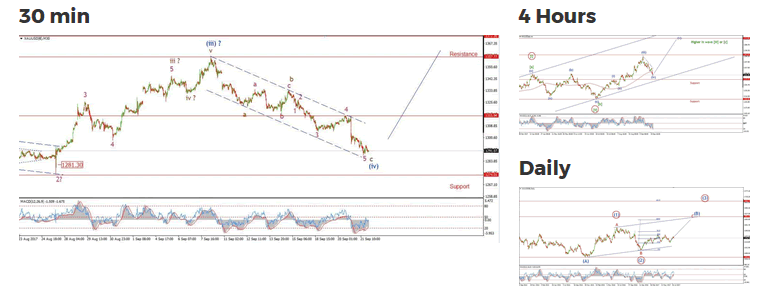
GOLD

My Bias: Long towards 1550
Wave Structure: ZigZag correction to the upside.
Long term wave count: Topping in wave (B) at 1550
Important risk events: USD: N/A.
I am starting to think that the short term wave count in gold does not account for the larger decline off the recent high very well.
It is possible that the alternate wave count shown on the daily chart is more fitting.
That wave count far more bullish in the medium term
and calls for a succession of higher lows
in a bullish series of 1,2 waves to the upside.
I will introduce that alternate count if the price drops below support 1274.
For the moment,
The declines labelled wave (iv) blue seemed to have concluded.
The 4hr chart shows that momentum has reached a bearish extreme.
The price should turn up from here, according to both wave counts.
For tomorrow;
1315 remains the key level to cross to indicate a turn back up into wave (v) blue.
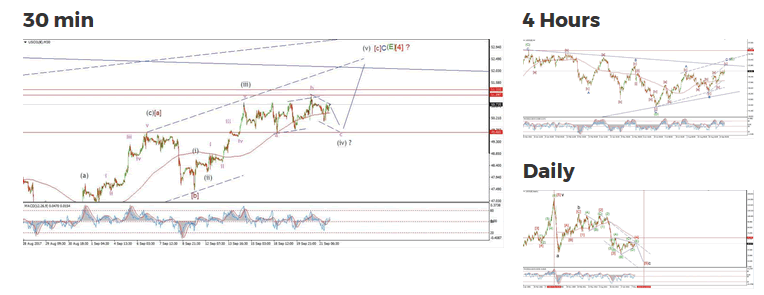
U.S CRUDE OIL

My Bias: topping in a large correction fourth wave.
Wave Structure: ZigZag correction to the downside.
Long term wave count: Declining in wave 'c' target, below $20
Important risk events: USD: N/A.
The short term action in crude shows that wave (iv) grey has taken a more complex form.
It now seems likely that wave (iv) grey has traced out a triple combination correction.
This wave form is about the most complex you can get!
It forms out of three separate complete corrective patterns join to create a larger three wave pattern.
I have shown a declining trend channel in wave 'c' of (iv).
This trend channel suggests a further decline in price towards 49.00 to complete wave (iv) grey.
For tomorrow;
The high labelled wave 'b' is at 51.11 in the cash market.
That level should hold tomorrow as wave 'c' closes out.
The price should bottom in the 49.00 area to complete wave (iv) grey.
Enda Glynn
http://bullwaves.org
I am an Elliott wave trader,
I have studied and traded using Elliott wave analysis as the backbone of my approach to markets for the last 10 years.
I take a top down approach to market analysis
starting at the daily time frame all the way down to the 30 minute time frame.
© 2017 Copyright Enda Glynn - All Rights Reserved
Disclaimer: The above is a matter of opinion provided for general information purposes only and is not intended as investment advice. Information and analysis above are derived from sources and utilising methods believed to be reliable, but we cannot accept responsibility for any losses you may incur as a result of this analysis. Individuals should consult with their personal financial advisors.
© 2005-2022 http://www.MarketOracle.co.uk - The Market Oracle is a FREE Daily Financial Markets Analysis & Forecasting online publication.


