


EUR/USD and Bearish Formation on Horizon
Currencies / Forex Trading Sep 26, 2017 - 12:28 PM GMTBy: Nadia_Simmons

 Earlier today, the euro extended losses against the greenback, which resulted in a breakdown below the lower border of the trend channel. Will this bearish development trigger bigger move to the downside in the coming week?
EUR/USD
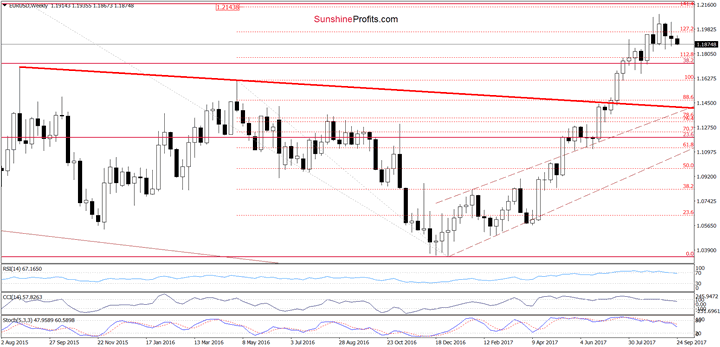
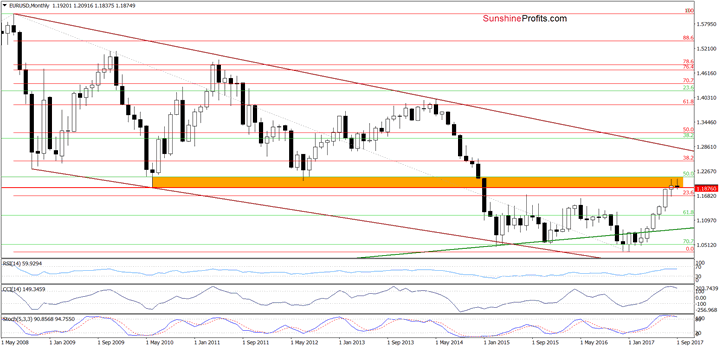
Looking at the charts from the broader perspective, we see that the overall situation hasn’t changed much as EUR/USD is still trading in the orange resistance zone – below the 2010 and July 2012 lows (in terms of monthly closing prices), which suggests that the 2017 upward move could be a verification of the earlier breakdown below these levels.
Additionally, the long-term indicators remain around their highest levels since April 2014. As a reminder, back then, such high readings of the CCI and Stochastic Oscillator preceded bigger move to the downside, which suggests that we may see a similar price action in the coming week(s).
On top of that, the sell signals generated by the medium-term indicators remain in cards, supporting currency bears and further deterioration. This scenario is also reinforced by the short-term picture of the exchange rate.
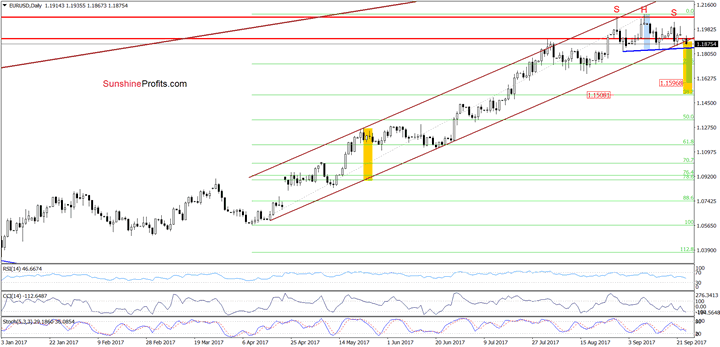
As you see on the daily chart, EUR/USD declined and slipped under the lower border of the brown rising trend channel earlier today. In our opinion, this is a bearish development, which suggests further deterioration – especially if the exchange rate closes today’s session under this important line.
What could happen if we see such price action? Looking at the above chart, we clearly see a potential head and shoulders formation. Therefore, if EUR/USD declines under the neck line of the pattern (the blue support line based on the previous lows), we’ll see a downward move to around 1.1596, where the size of the move will correspond to the height of the formation.
However, when we take into account a drop under the lower border of the brown rising trend channel and the broader picture of EUR/USD, we think that currency bears push the exchange rate even lower – to around 1.1508, where the size of declines will be equal to the height of trend channel. Taking all the above into account, we believe that our (already profitable) short positions are justified from the risk/reward perspective.
GBP/USD
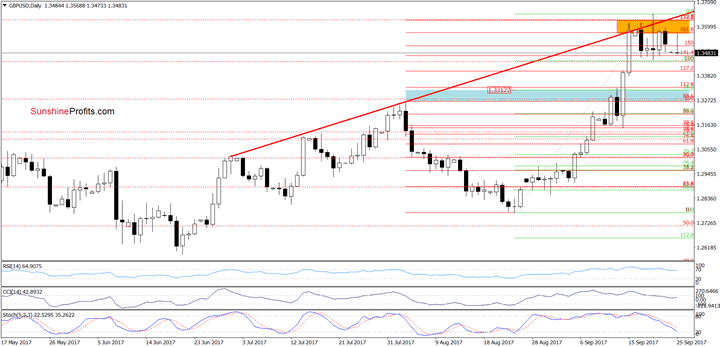
Looking at the above charts, we see that although GBP/USD moved a bit higher earlier today, the orange resistance zone (created by the very long-term red declining resistance line based on the July 2014 and June 2016 peaks (marked on the weekly chart), the red increasing resistance line based on the previous highs (seen on the daily chart) and the area between the 161.8% and 173.2% Fibonacci extensions) stopped currency bulls, triggering a sharp pullback. Thanks to this drop GBP/USD approached the last week’s lows, which together with the sell signals generated by the daily indicators suggest lower values of the exchange rate in the coming week.
How low could the pair go? In our opinion, if the exchange rate moves lower from current levels, we’ll see a drop to around 1.3266-1.3291, where the 38.2% Fibonacci retracement based on the August-September upward move and the August high are.
USD/CAD
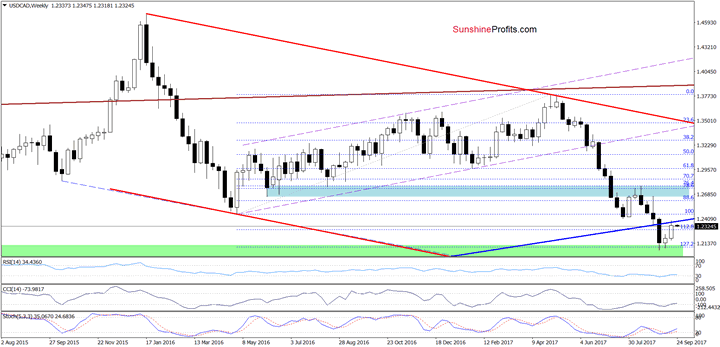
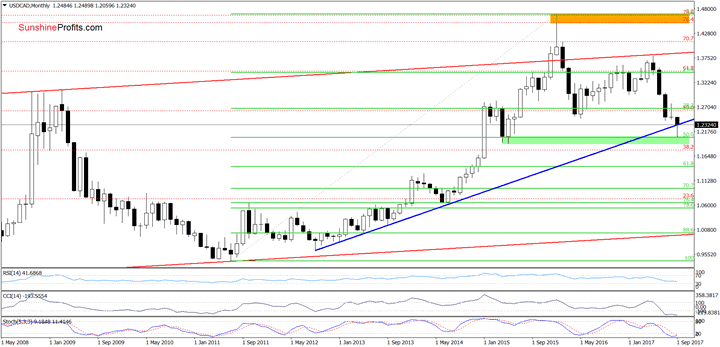
Looking at the above charts, we see that the previously-broken long-term blue support line (which currently serves as the nearest resistance) based on the September 2012, September 2013 and June 2014 lows (seen more clearly on the monthly chart) stopped currency bulls in the previous week. Earlier today, their opponents pushed the pair a bit lower, but will we see further deterioration in the coming week? Let’s take a closer look at the daily chart and find out.
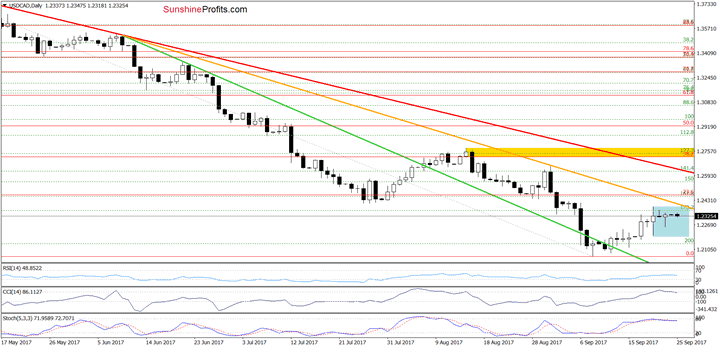
From the very short-term perspective, we see that USD/CAD is consolidating under the orange declining resistance line and the July lows, which suggests that the recent upward move could be a verification of the earlier breakdown below them and the above-mentioned long-term blue support/resistance line.
Additionally, the CCI and the Stochastic Oscillator generated the sell signals, increasing the probability of reversal and lower values of USD/CAD in the coming week. If this is the case and the pair moves lower, the initial downside target will be the lower border of the blue consolidation (around 1.2196). If this support is broken, a test of the recent lows can’t be ruled out.
If you enjoyed the above analysis and would like to receive free follow-ups, we encourage you to sign up for our daily newsletter – it’s free and if you don’t like it, you can unsubscribe with just 2 clicks. If you sign up today, you’ll also get 7 days of free access to our premium daily Oil Trading Alerts as well as Gold & Silver Trading Alerts. Sign up now.
Thank you.
Nadia Simmons
Forex & Oil Trading Strategist
Przemyslaw Radomski
Founder, Editor-in-chief
Sunshine Profits: Gold & Silver, Forex, Bitcoin, Crude Oil & Stocks
Stay updated: sign up for our free mailing list today
* * * * *
Disclaimer
All essays, research and information found above represent analyses and opinions of Nadia Simmons and Sunshine Profits' associates only. As such, it may prove wrong and be a subject to change without notice. Opinions and analyses were based on data available to authors of respective essays at the time of writing. Although the information provided above is based on careful research and sources that are believed to be accurate, Nadia Simmons and his associates do not guarantee the accuracy or thoroughness of the data or information reported. The opinions published above are neither an offer nor a recommendation to purchase or sell any securities. Nadia Simmons is not a Registered Securities Advisor. By reading Nadia Simmons’ reports you fully agree that he will not be held responsible or liable for any decisions you make regarding any information provided in these reports. Investing, trading and speculation in any financial markets may involve high risk of loss. Nadia Simmons, Sunshine Profits' employees and affiliates as well as members of their families may have a short or long position in any securities, including those mentioned in any of the reports or essays, and may make additional purchases and/or sales of those securities without notice.
© 2005-2022 http://www.MarketOracle.co.uk - The Market Oracle is a FREE Daily Financial Markets Analysis & Forecasting online publication.