Are Gold and the US Dollar Rallying Together?
Commodities / Gold and Silver 2017 Oct 10, 2017 - 11:46 AM GMTBy: Clive_Maund
 Technical analyst Clive Maund examines the relationship between the dollar and precious metals.The last gold Market update almost a month ago called the intermediate top within a day, as you may recall, and the subsequent Gold and U.S. Dollar called the rally in the dollar the day before it started. Having seen a significant reaction back by gold, the question now is "Has it run its course?" The short answer to that is yes, although calling a bottom here is complicated by the fact that gold's COTs have not eased as much on the reaction as we might have expected, and the dollar Hedgers' chart is still flat out bullish for the dollar. What this means is that we may need to see some bottoming action by gold, even if it soon breaks out of its rather steep short-term downtrend, and another possibility that we will examine is that the dollar and gold rally in tandem, a rare circumstance that could be occasioned by an extreme development such as an attack on North Korea, although if this happens the peoples of Seoul and Tokyo will doubtless have more important things to think about than the price of gold.
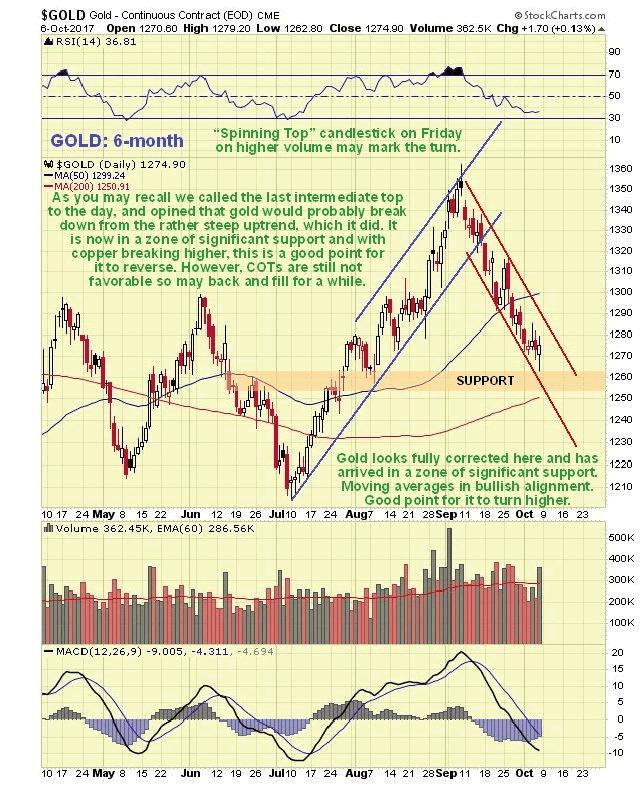
On gold's latest 6-month chart we can see how the reaction of recent weeks has retraced about 50% of the prior rally, as tensions with North Korea have temporarily eased. This reaction has more than fully corrected the overbought condition resulting from the rally, and has brought gold back into a zone of significant support just above its rising 200-day moving average, and with moving averages in bullish alignment, conditions generally favor a reversal and rally. The "spinning top" candlestick that occurred on Friday on increased volume may mark the turn, although the candlesticks that occurred on the charts for silver and silver proxies look like more convincing reversals.
An important factor having a bearing on the outlook for the precious metals was the nice reversal in copper on Thursday after a significant reaction, with it gaining nearly 3%...
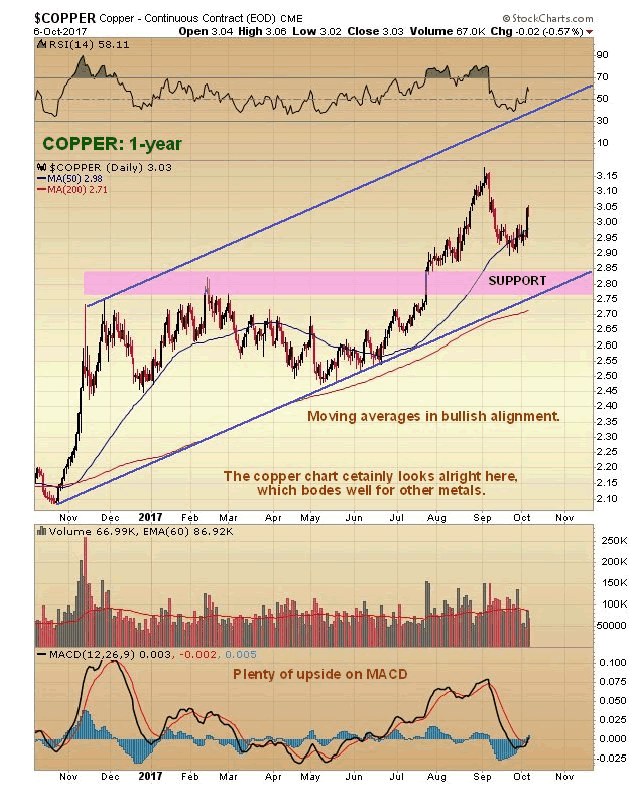
Given that copper tends to lead other metals as it did on the last rally, this could well be followed by gold and silver reversing to the upside after their reaction back to support, despite the dollar looking like it has further to rally. Another positive factor for gold and silver is that there was a full moon late last week and the Precious Metals often reverse on either the new or full moon, although astrologically silver is ruled by the moon and gold by the sun, which may explain why the Incas, famous for their gold, worshiped the sun – which makes a lot more sense than many of the other things that get worshiped. If you think that is wacky, try this for size—eclipses are thought by many astrologers to be a baleful omen, and you may recall that on August 21st a total eclipse of the sun slashed right across the U.S. from coast to coast. Soon after, the country was clobbered by a succession of natural disasters, in addition to Donald Trump’s Tweetstorms, with three massively destructive hurricanes impacting Texas, then Florida, and lastly Puerto Rico. Coincidence? I think not.
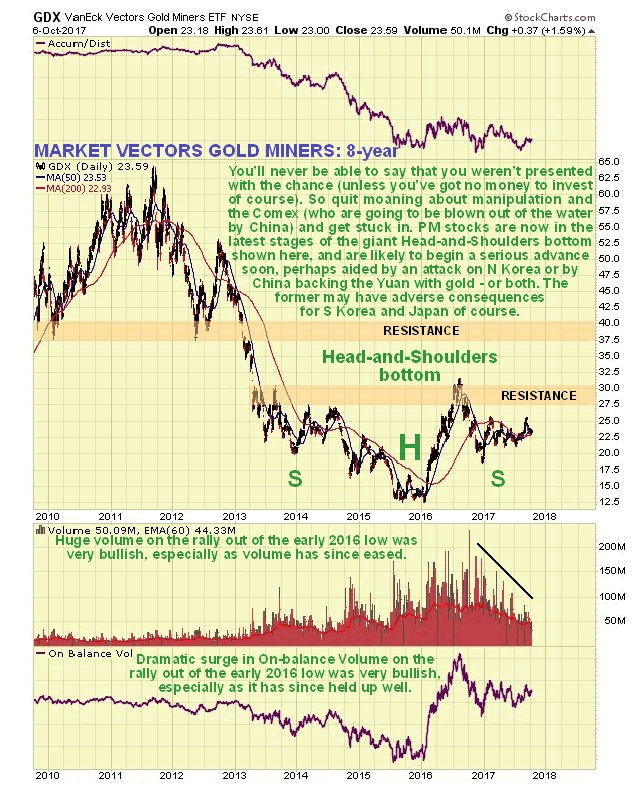
On gold's 8-year chart it continues to look like it is in the late stages of a giant Head-and-Shoulders bottom pattern. The buildup in volume over past 20 months certainly looks positive, especially over the past several months, all the more so because it has driven volume indicators higher, notably the Accum-Distrib line, which is not far off making new highs—exceeding its level at the 2011 peak. Once gold breaks above the resistance level approaching $1400 it will be on its way, although it will then have to contend another important band of resistance in the $1510 - $1560 range.
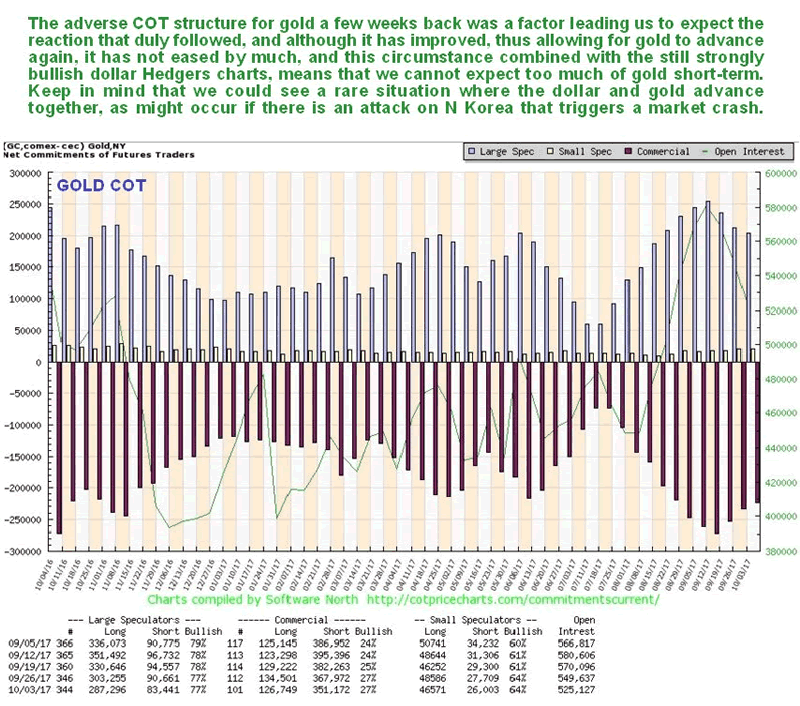
The latest COT chart for gold shows that, while positions have certainly eased on the reaction of recent weeks, they have not eased by as much as one would expect, which sounds a cautionary note and suggests that a rally now may be stunted, and followed by more basing action before a larger uptrend can gain traction. This accords with what we are seeing on the dollar charts, especially the latest dollar Hedgers' chart.
The Market Vectors Gold Miners, GDX, which functions as a gold stocks index, is marking out a giant Head-and-Shoulders bottom that roughly parallels the one completing in gold itself. The fact that the price is still well below the strong resistance at the top of this reversal pattern means that prices for many gold (and silver) stocks are still very favorable. The volume pattern during the build out of this base pattern is very bullish, with big volume on the rise out of the low (Head) of the pattern, tailing off steadily as the Right Shoulder has formed.

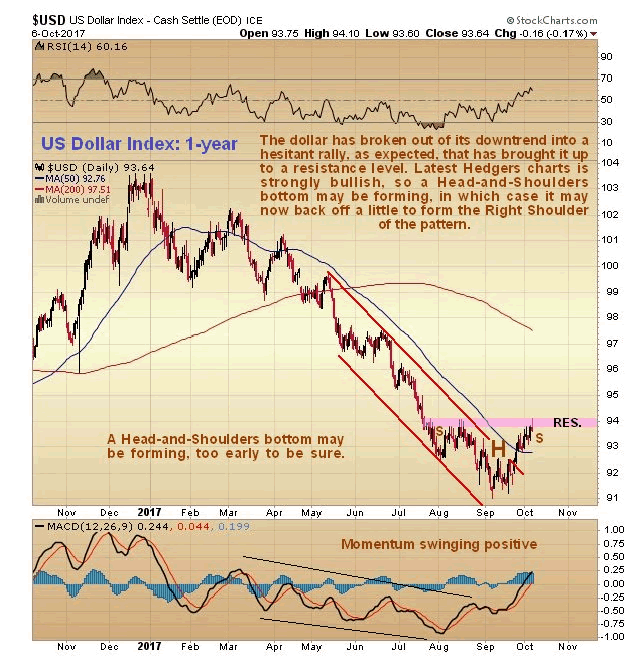
The dollar looks like it has put in an intermediate bottom. On the 1-year dollar index chart shown below, we can see that it has broken out of its downtrend by a significant margin and looks like it may be marking out a Head-and-Shoulders bottom, although it is still too early to be sure. If it is then we will see a shallow dip to mark out the Right Shoulder of the pattern before it then turns higher.
The latest dollar Hedgers' chart certainly looks bullish, with the large Commercial Hedgers having cleared out their short positions…
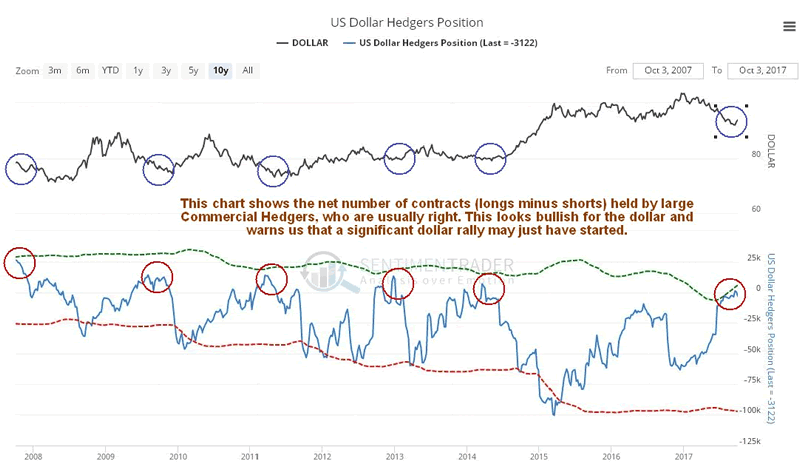
Chart courtesy of www.sentimentrader.com
Although we cannot reconcile this positive dollar outlook for the medium-term (long-term outlook remains bearish) with a positive outlook for the precious metals sector, there are times when the dollar and gold and silver rally together. This could happen for example if some drastic action is taken with respect to North Korea.
Clive Maund has been president of www.clivemaund.com, a successful resource sector website, since its inception in 2003. He has 30 years' experience in technical analysis and has worked for banks, commodity brokers and stockbrokers in the City of London. He holds a Diploma in Technical Analysis from the UK Society of Technical Analysts.
Want to read more Gold Report articles like this? Sign up for our free e-newsletter, and you'll learn when new articles have been published. To see recent articles with industry analysts and commentators, visit our Streetwise Interviews page.
Disclosure:
1) Statements and opinions expressed are the opinions of Clive Maund and not of Streetwise Reports or its officers. Clive Maund is wholly responsible for the validity of the statements. Streetwise Reports was not involved in the content preparation. Clive Maund was not paid by Streetwise Reports LLC for this article. Streetwise Reports was not paid by the author to publish or syndicate this article.
2) This article does not constitute investment advice. Each reader is encouraged to consult with his or her individual financial professional and any action a reader takes as a result of information presented here is his or her own responsibility. By opening this page, each reader accepts and agrees to Streetwise Reports' terms of use and full legal disclaimer. This article is not a solicitation for investment. Streetwise Reports does not render general or specific investment advice and the information on Streetwise Reports should not be considered a recommendation to buy or sell any security. Streetwise Reports does not endorse or recommend the business, products, services or securities of any company mentioned on Streetwise Reports.
Charts provided by the author.
© 2005-2022 http://www.MarketOracle.co.uk - The Market Oracle is a FREE Daily Financial Markets Analysis & Forecasting online publication.


