Stock Market October Crash 2017 But Not as the Bears Expected!
Stock-Markets / Stock Market 2017 Oct 24, 2017 - 06:01 PM GMTBy: Nadeem_Walayat
 OCTOBER the month when the stock market doom merchants are at their most vocal as they focus on the historic apex of the darkest day of the darkest month for stocks of each year, October 19th, this year was the 30th anniversary of the 1987 stock market Black Monday crash that saw the market fall of a cliff, plunging by an unprecedented 22% on one day that few saw coming but ever since many prophesise the repeat of every October. Furthermore this year marks the 9th October of the current stocks bull market that the perma-crowd have been betting against for its duration. Which means that most of the doom merchants will already have gotten the stock market badly wrong for EIGHT OCTOBERS IN A ROW!
So lets see how the 9th October of this bull market is panning out as we leave the 19th of October crash anniversary behind and enter the final week of the GREAT CRASH is COMING month, bearing in mind that a coin toss tends to be right 50% of the time!
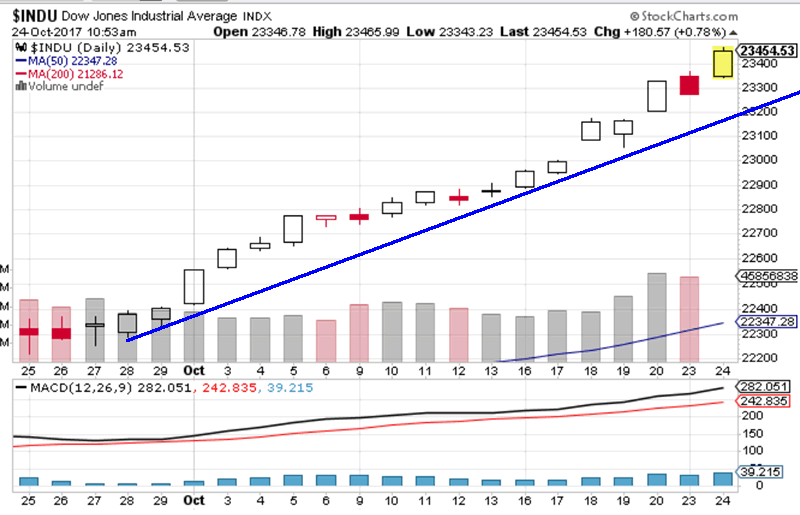
Yes, there clearly has been a stock market CRASH during October, but unfortunately for the bears the crash has been to the UPSIDE!
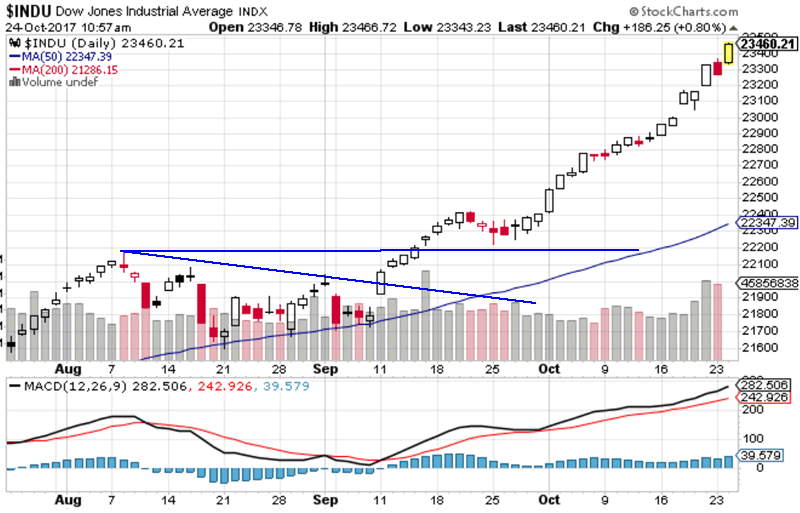
The 3 month chart illustrates that after the market caught its breath during late Summer, it was LIFT OFF time AGAIN!
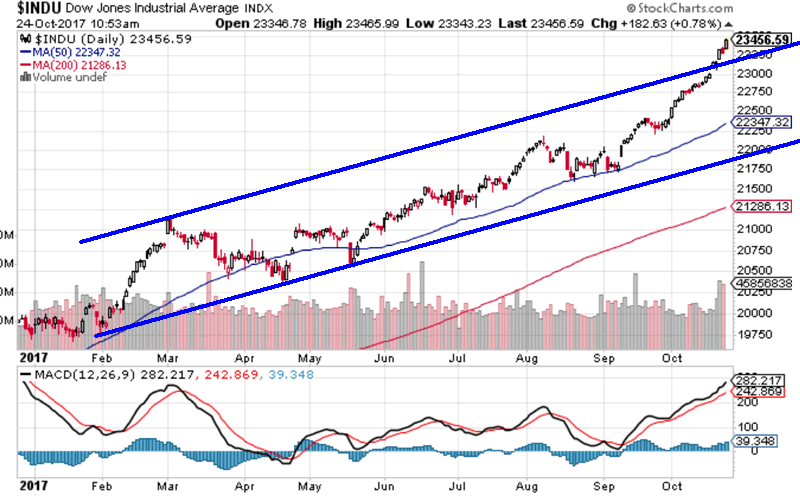
Whilst the chart for 2017 illustrates just how powerful the bull market has been this year. Unfortunately for many bulls, including me who at the start of the year, after 8 strong years, I failed envisage that the market would be able to put in another strong bull run for 2017, and thus at the time it appeared very plausible that the market would correct by 20% or so during 2017, delivering a good buying opportunity for stock bulls.
As for the 1987 Crash, well for the few who traded it (including myself), then it, and its aftermath provided many valuable investing lessons that are just as valid today as they were 30 years ago! So do watch my video made on the 30th anniversary of the Great Crash to LEARN REAL INVESTING LESSONS, and not the usual garbage produced by those who NEVER TRADED the GREAT CRASH!
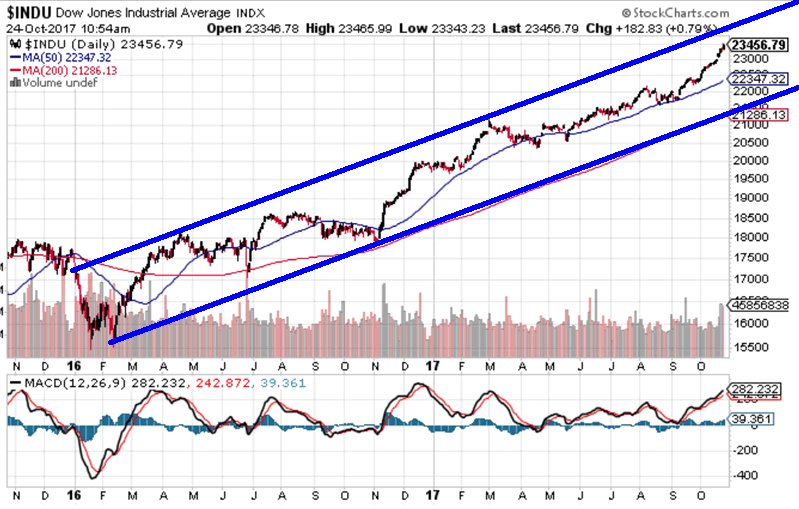
The two year chart continues to paint the relentless nature of this great stocks bull market.
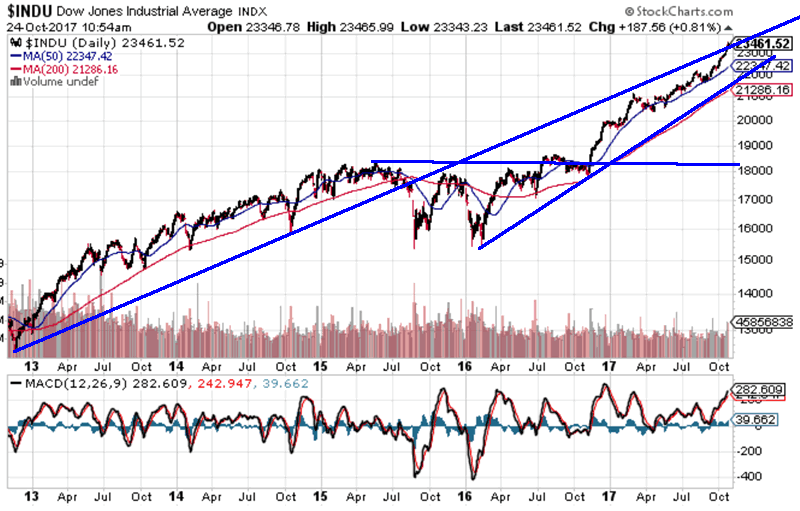
The five year chart illustrates what I have been stating since this bull markets inception in March 2009 that this will prove to be one of the greatest bull markets in history, that I expected would go for far longer and far higher than anyone could imagine! And so far the market has more than fulfilled those expectations.
My 1000+ articles and ebook's illustrate my early years view on what what I then termed as being a stocks stealth bull market that most never saw coming given the perma mantra of first a lower top and then a double top that the market subsequently long left behind in a series of new all time highs spanning many years. So do read my early stocks ebook's to learn the mindset of how to be on the RIGHT SIDE OF A BULL MARKET (only requirement a valid email address).
As for what the market will do next, well this does require in-depth analysis as the market does NOT give away easy money, one has to work for it. So do ensure you are subscribed to my youtube channel and free newsletter for notification of this.
Dow Current View

However, I understand many are eager for my view on what the stock market could do next, and so my current view is that the market is EXTREMELY OVERBOUGHT and PRIMED for a correction. This is clearly evident when looking at the MACD indicator. So technically I cannot see who this market can continue higher, despite the fact that we are about to enter the traditionally strongest period of the year in the run up to Christmas. Exactly when, for how long and how deep remains to be determined. But the Dow could easily retrace all the way to below 22,000 which compares against current Dow quote of 23,454. And that is my current view of the stock market, technically extremely overbought implying an imminent correction for a trend that would be is contrary to the seasonal pattern taking the Dow to below 22,000.
Your analyst awaiting a significant deviation from the bull market high to BUY stocks leveraged to the emerging Machine Intelligence and War with China mega-trends.
Source and Comments: http://www.marketoracle.co.uk/Article60574.html
By Nadeem Walayat
Copyright © 2005-2017 Marketoracle.co.uk (Market Oracle Ltd). All rights reserved.
Nadeem Walayat has over 30 years experience of trading derivatives, portfolio management and analysing the financial markets, including one of few who both anticipated and Beat the 1987 Crash. Nadeem's forward looking analysis focuses on UK inflation, economy, interest rates and housing market. He is the author of five ebook's in the The Inflation Mega-Trend and Stocks Stealth Bull Market series that can be downloaded for Free.
 Nadeem is the Editor of The Market Oracle, a FREE Daily Financial Markets Analysis & Forecasting online publication that presents in-depth analysis from over 1000 experienced analysts on a range of views of the probable direction of the financial markets, thus enabling our readers to arrive at an informed opinion on future market direction. http://www.marketoracle.co.uk
Disclaimer: The above is a matter of opinion provided for general information purposes only and is not intended as investment advice. Information and analysis above are derived from sources and utilising methods believed to be reliable, but we cannot accept responsibility for any trading losses you may incur as a result of this analysis. Individuals should consult with their personal financial advisors before engaging in any trading activities.
Nadeem Walayat Archive |
© 2005-2022 http://www.MarketOracle.co.uk - The Market Oracle is a FREE Daily Financial Markets Analysis & Forecasting online publication.


