


More Volatility As Stocks Retrace Some Of Their Recent Rally
Stock-Markets / Stock Market 2017 Oct 26, 2017 - 04:11 PM GMTBy: Paul_Rejczak

 Briefly:
Intraday trade: Our Wednesday's intraday trading outlook was bearish. It proved accurate because the S&P 500 index lost 0.5%, following neutral opening of the trading session. However, the market didn't reach our intraday profit target level of 2,535 (daily low at 2,544.00). The S&P 500 index may retrace more of its October rally. Therefore, intraday short position is favored again. Stop-loss is now at the level of 2,575 and potential profit target is at 2,535 (S&P 500 index).
Our intraday outlook is bearish today. Our short-term outlook is neutral, and our medium-term outlook is neutral:
Intraday outlook (next 24 hours): bearish
Short-term outlook (next 1-2 weeks): neutral
Medium-term outlook (next 1-3 months): neutral
The main U.S. stock market indexes lost 0.5% on Wednesday, as investors took short-term profits off the table following recent move up. The S&P 500 index fell the lowest since early October, before bouncing off support level at around 2,550. It currently trades 0.8% below Monday's new record high of 2,578.29. The Dow Jones Industrial Average retraced some of its recent rally yesterday, as it fell 0.5%. It bounced off resistance level marked by Tuesday's new all-time high of 23,485.25. The technology Nasdaq Composite trades around 1.2% below its Monday's new record high of 6,641.57. The nearest important level of support of the S&P 500 index is at 2,545-2,550, marked by yesterday's daily low and some previous local lows. The next support level is at 2,520-2,530, marked by the October 2 daily gap up of 2,519.44-2,520.40, among others. On the other hand, resistance level is at 2,565-2,570, marked by short-term fluctuations. The next level of resistance is at around 2,580, marked by the above-mentioned all-time high. The S&P 500 index retraced some of its recent advance yesterday, as it fell below the level of 2,550. Is this a new downtrend or just quick downward correction before another leg up? There have been no confirmed negative signals so far. However, we still can see medium-term technical overbought conditions:
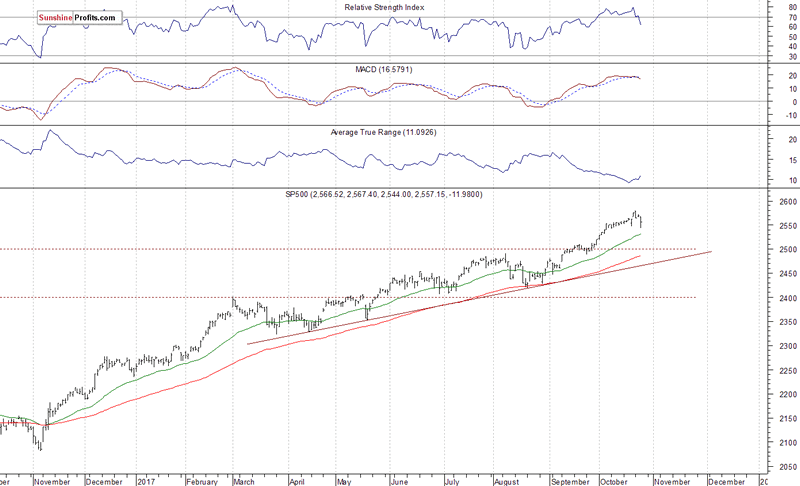
Short-Term Fluctuations
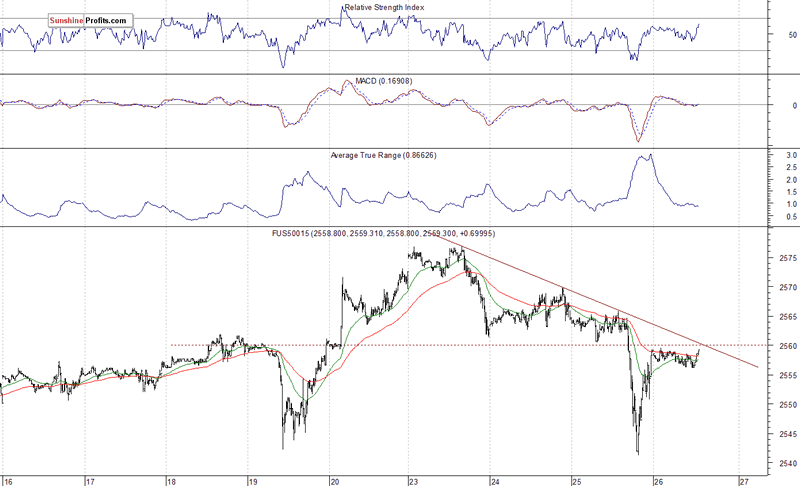
Expectations before the opening of today's trading session are virtually flat, with index futures currently between 0.0% and +0.1% vs. yesterday's closing prices. The European stock market indexes have gained 0.3-0.4% so far. Investors will now wait for some economic data announcements: Initial Claims, Trade Balance at 8:30 a.m., Pending Home Sales at 10:00 a.m. The market expects that Initial Claims were at 235,000 last week. Investors will also wait for more quarterly corporate earnings releases. The S&P 500 futures contract trades within an intraday consolidation, following yesterday's intraday bounce. The market retraced most of its decline, as it gained almost 20 points off the daily low. The nearest important level of support is at around 2,540-2,550. On the other hand, resistance level is at 2,560-2,570, marked by recent consolidation. The futures contract is slightly below its short-term downward trend line, as the 15-minute chart shows:
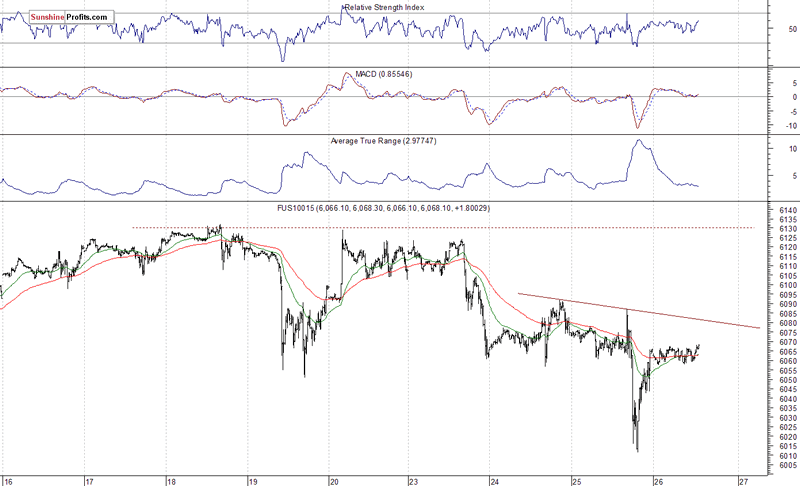
Nasdaq Remains Slightly Weaker
The technology Nasdaq 100 futures contract follows a similar path, as it trades within an intraday consolidation following bounce off yesterday's daily low. The nearest important level of resistance is at around 6,080-6,100, and the next resistance level is at 6,120-6,130, marked by record high. On the other hand, support level is at around 6,050-6,060, marked by local lows. The next level of support is at 6,000-6,020. The Nasdaq 100 futures contract trades along its recent consolidation, as we can see on the 15-minute chart
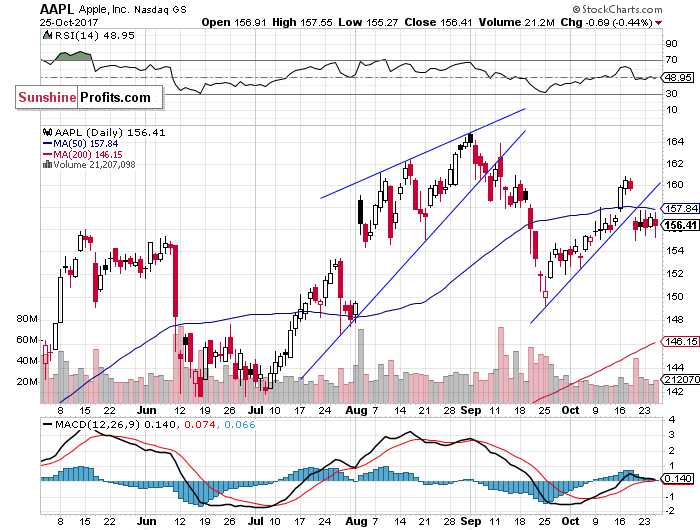
Let's take a look at Apple, Inc. stock (AAPL) daily chart (chart courtesy of http://stockcharts.com). It broke below its short-term upward trend line last week, after reaching resistance level of $160. Since then it fluctuates within a short-term consolidation along the price of $156. Is this a new downtrend or just downward correction following recent advance?
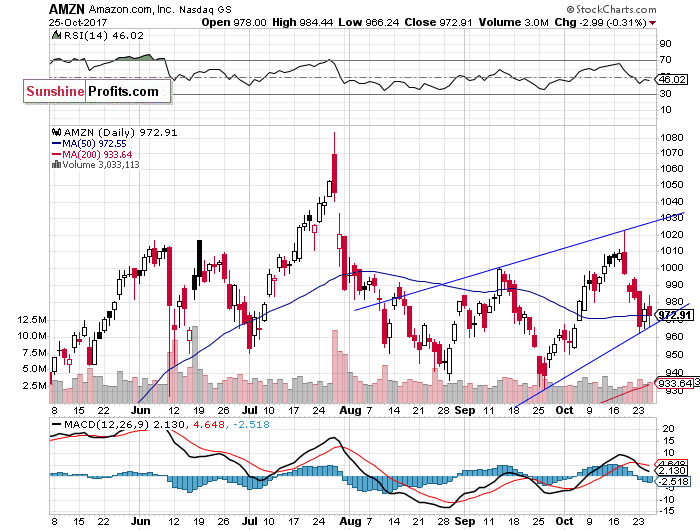
Now, let's take a look at Amazon.com, Inc. stock (AMZN) daily chart (chart courtesy of http://stockcharts.com). Amazon will announce its quarterly earnings after trading session today. Will it break below three-month-long rising wedge pattern? Or bounce off upward trend line at around $970? The market extends its medium-term fluctuations:
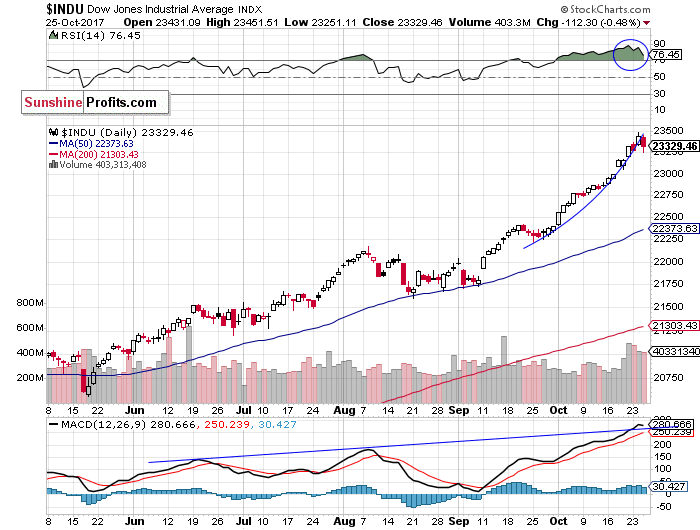
The Dow Jones Industrial Average daily chart (chart courtesy of http://stockcharts.com) shows that blue-chip index fluctuates following its recent rally. The market retraced some of its recent move up. We still can see clear technical overbought conditions. Is this a medium-term blow-off top pattern?
Concluding, the S&P 500 index lost 0.5% on Wednesday, as it retraced some its recent advance. The broad stock market fell the lowest since early October. However, it has managed to bounce back again following quick move below the level of 2,550. Investors will wait for more quarterly corporate earnings releases. Will they drive stock prices even higher? Will the broad stock market follow blue-chip stocks (DJIA index) euphoria-rally? Or is this some topping pattern before downward correction?
If you enjoyed the above analysis and would like to receive free follow-ups, we encourage you to sign up for our daily newsletter – it’s free and if you don’t like it, you can unsubscribe with just 2 clicks. If you sign up today, you’ll also get 7 days of free access to our premium daily Gold & Silver Trading Alerts. Sign up now.
Thank you.
Paul Rejczak
Stock Trading Strategist
Stock Trading Alerts
SunshineProfits.com
Stock market strategist, who has been known for quality of his technical and fundamental analysis since the late nineties. He is interested in forecasting market behavior based on both traditional and innovative methods of technical analysis. Paul has made his name by developing mechanical trading systems. Paul is the author of Sunshine Profits’ premium service for stock traders: Stock Trading Alerts.
* * * * *
Disclaimer
All essays, research and information found above represent analyses and opinions of Paul Rejczak and Sunshine Profits' associates only. As such, it may prove wrong and be a subject to change without notice. Opinions and analyses were based on data available to authors of respective essays at the time of writing. Although the information provided above is based on careful research and sources that are believed to be accurate, Paul Rejczak and his associates do not guarantee the accuracy or thoroughness of the data or information reported. The opinions published above are neither an offer nor a recommendation to purchase or sell any securities. Mr. Rejczak is not a Registered Securities Advisor. By reading Paul Rejczak’s reports you fully agree that he will not be held responsible or liable for any decisions you make regarding any information provided in these reports. Investing, trading and speculation in any financial markets may involve high risk of loss. Paul Rejczak, Sunshine Profits' employees and affiliates as well as members of their families may have a short or long position in any securities, including those mentioned in any of the reports or essays, and may make additional purchases and/or sales of those securities without notice.
Paul Rejczak Archive |
© 2005-2022 http://www.MarketOracle.co.uk - The Market Oracle is a FREE Daily Financial Markets Analysis & Forecasting online publication.