Bullish Opportunity in Crude Oil - Watch Out!
Commodities / Crude Oil Oct 27, 2017 - 02:43 PM GMTBy: Enda_Glynn
My Bias: topping in a large correction wave [4].
Wave Structure: Double combination higher in wave [4] red.
Long term wave count: wave [4] target $70

After a week of indecisive action in crude, the time has come to change tack and sail with the wind again!
Although the wave count in crude has worked quite well over the last month, the current price action has not matched what was called for in the wave count.
At times like these it serves well to have a viable alternate wave count in the sidelines ready to activate if needed.
Now is one of those times!
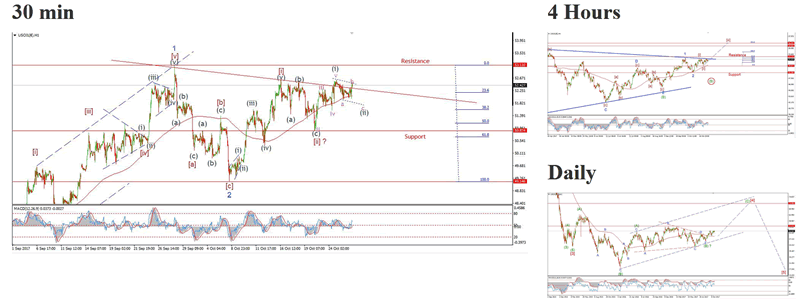
You can see on the daily chart that the upper target for crude is in the region of $70 in wave C of [4].
I have switched to the alternate wave count in crude today following continued corrective downside action.
The current wave count sits at a very pivotal point 'in the price structure.
With a possible third of a third wave up, on the cards over the next few weeks.
On the daily chart you can see the price target for wave [4] red lies at about $70 and change.
On the 4hr chart the price structure has possibly completed wave 1,2 in blue and wave [i], [ii] in brown.
with wave [iii] on the verge of starting.
On the short term chart waves (i) and (ii) in grey are still under way.
Wave (ii) grey is tracing out a flat correction as shown.
53.11 is the pivitol level from this point on,
I now expect this level to be broken soon as wave [iii] brown gets underway.
So,
Over the next weeks action;
Watch for a short decline to complete wave (ii) grey.
At that point looks for a bullish break of the wave '1' high to confirm wave '3' is underway.
If you want to be ready for the next opportunity in Crude, Gold, The DOW and the USD FX markets,
Check out the membership offers and stay on top of the price action!
BULLWAVES MEMBERSHIP
Enda Glynn
http://bullwaves.org
I am an Elliott wave trader,
I have studied and traded using Elliott wave analysis as the backbone of my approach to markets for the last 10 years.
I take a top down approach to market analysis
starting at the daily time frame all the way down to the 30 minute time frame.
© 2017 Copyright Enda Glynn - All Rights Reserved
Disclaimer: The above is a matter of opinion provided for general information purposes only and is not intended as investment advice. Information and analysis above are derived from sources and utilising methods believed to be reliable, but we cannot accept responsibility for any losses you may incur as a result of this analysis. Individuals should consult with their personal financial advisors.
© 2005-2022 http://www.MarketOracle.co.uk - The Market Oracle is a FREE Daily Financial Markets Analysis & Forecasting online publication.


