The Stock Market- From Here to Infinity?
Stock-Markets / Stock Market 2017 Nov 06, 2017 - 05:11 PM GMTBy: Plunger
 Rambus has shown that the move upward in the stock market continues to be unimpeded. I would concur with the caveat that early next year it may peak and end the 9 year bull market, so far the second longest in history. Momentum is still powering higher, however internal deterioration has begun to be evident. Here is one possible scenario for the ultimate top:
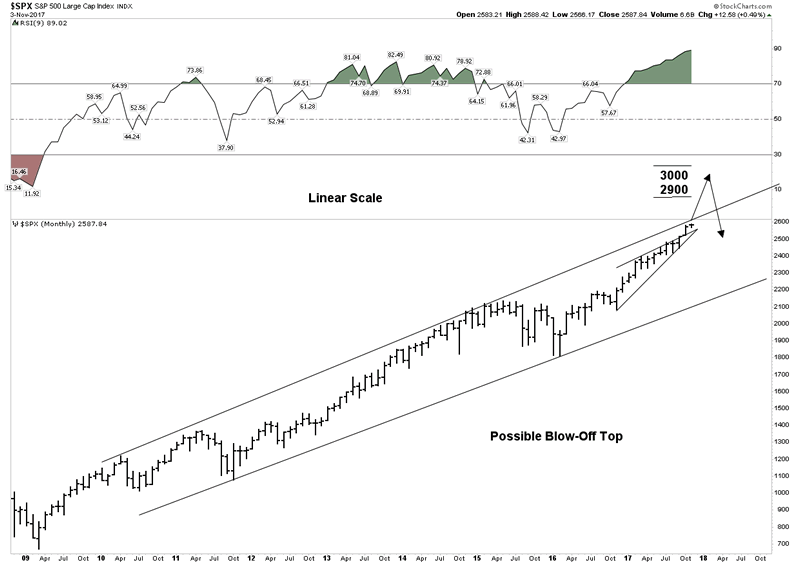
Above is a linear scale view of the 9 year bull market. It depicts a blow off top penetrating the upper trend channel with a target of 2900-3000. We see 3 phases to this bull market and the blow off would end the final phase III “mania”. Note the extreme reading in the RSI lending credence to this outcome.
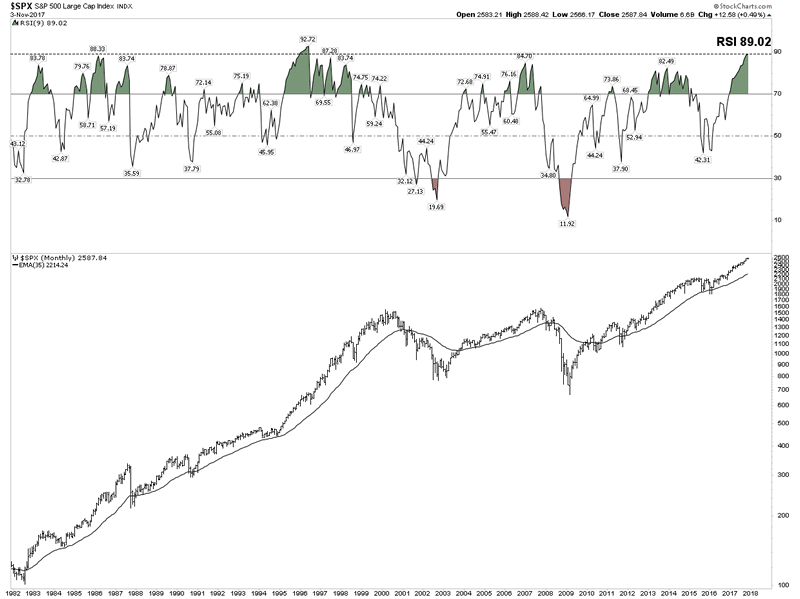
Below is a chart which highlights just how overbought and extended this market has become. It is a monthly view of the entire 36 year secular bull market. Note the RSI is now the second highest in the entire bull market. It is saying this relentless rise has reached a point where the RSI will limit its move.
I would like to show just how narrow the advance has become. We all know how the FANG stocks have led the market. The XLK includes a heavy weighting made up of the FANGS and FANG-like stocks. The rise been relentless:
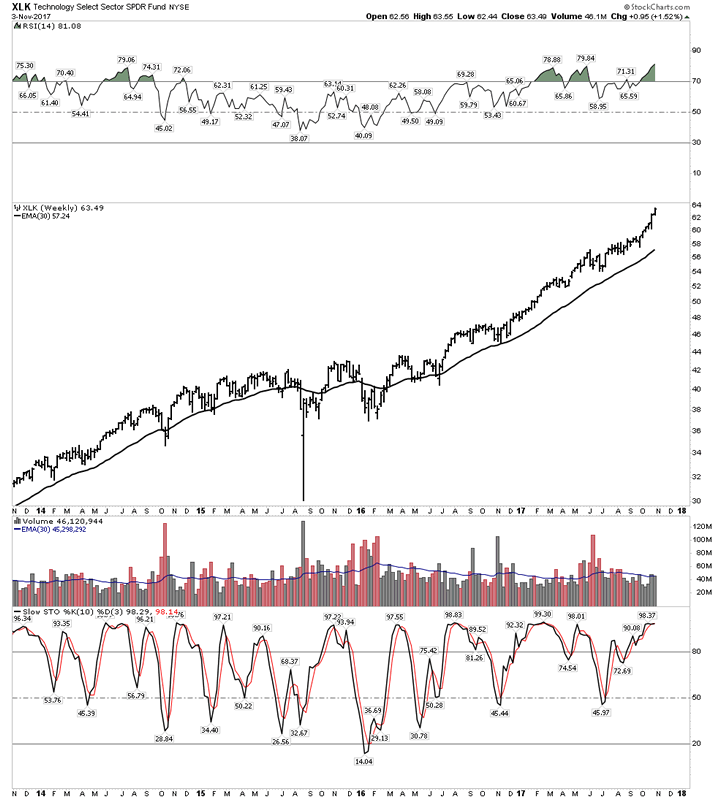
Note how extended stochastics and RSI have become. Also note how volume is trailing off despite this recent blow off move.
SPX-Equal Weighted Index
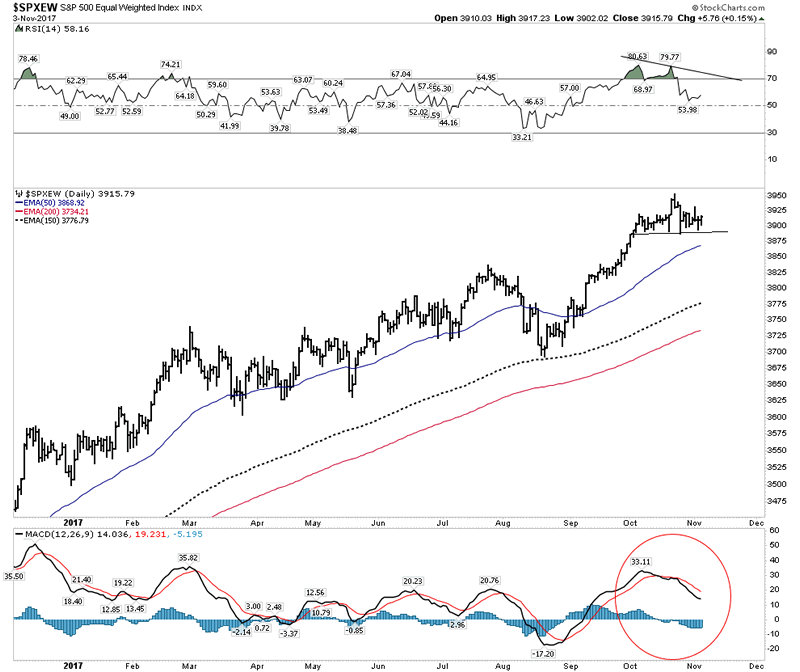
Below is the SPX represented as an equal weighted index. It values all 500 stocks equally vs the normal cap weighted measure. Here we see the trend solidly upward, however note that RSI is waning and it may be putting in a H&S top. MACD momentum is also indicating weakness.
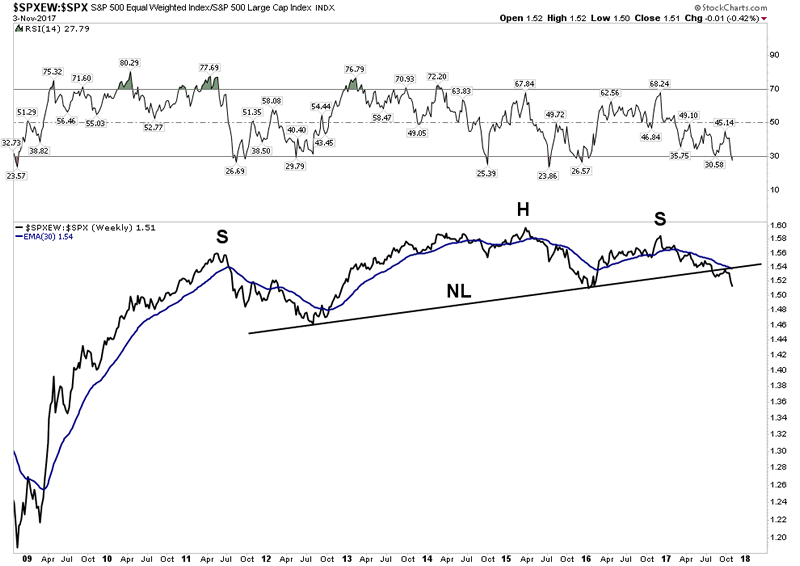
Now let’s go back and view the entire 9 year bull market and subtract out the cap weighted influence of the index as opposed to just neutralizing it. You will see it reveals the core of the market has not really gone anywhere for 7 years and it has recently broken its NL, followed up with a BT and is now resuming its downtrend.
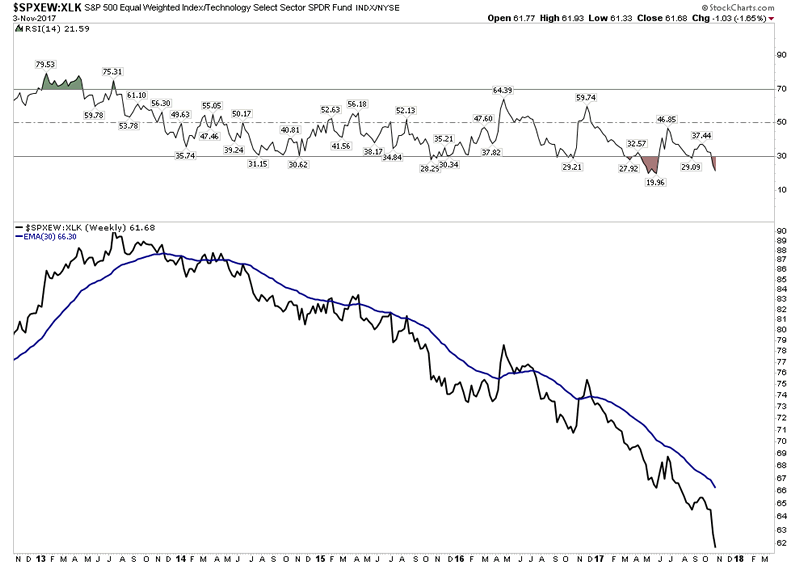
Finally, let’s remove the effect of the super momentum driven XLK for the past 5 years and what is revealed is something really shocking. That of course is a total implosion of the core of the market relative to the momentum driven XLK. The message here for us to understand is that this market is being driven by money flows into an increasingly narrow sector of the market. This is a classic final phase characteristic of a blow off market. It is not announcing an end tomorrow, but it tells one what season we are in.
Let’s look at a few charts that you should be aware of. Again, the message is not that the end is here, but the internals are deteriorating:
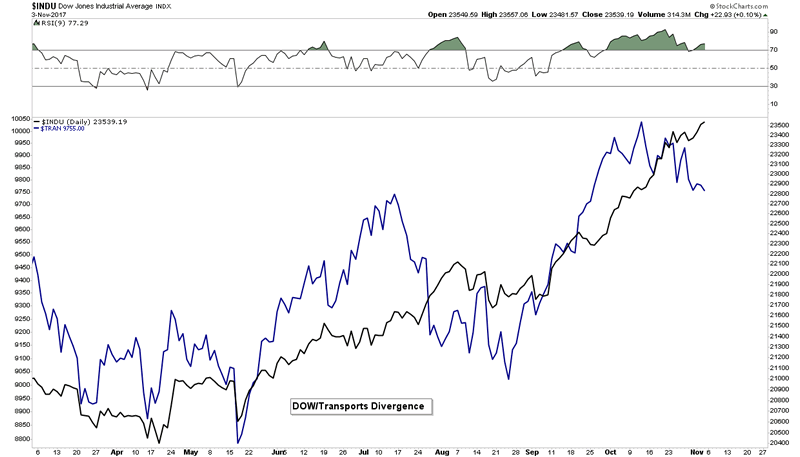
Dow Theory- Non Conformation
It’s only been in effect for three weeks, however this divergence needs to be corrected by the transports resuming its uptrend. Without a reversal upside, it signals trouble ahead:
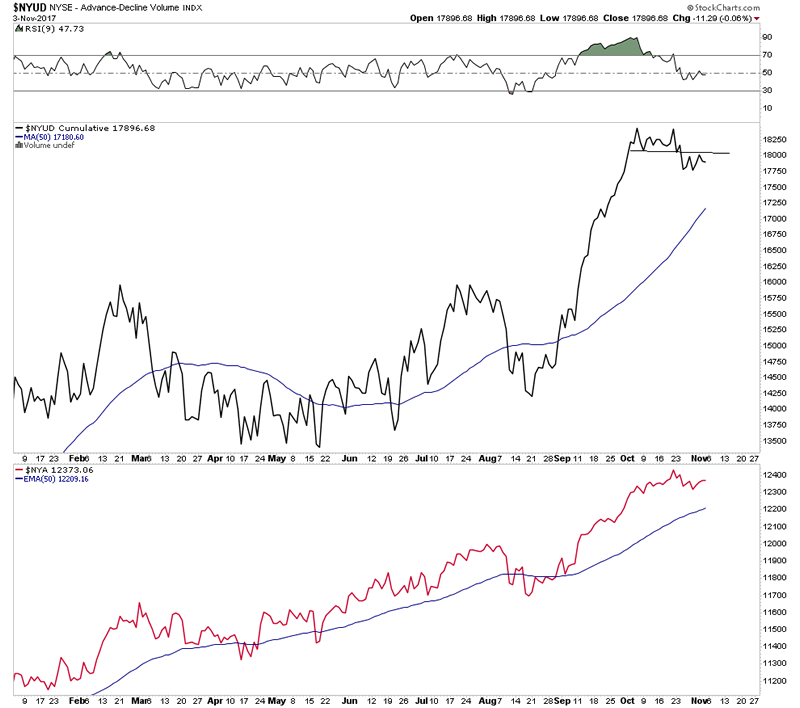
Advanced Decline Volume:
It’s too soon to call a top, however here we see the first step down in Adv/Decline volume indicating internal weakness.
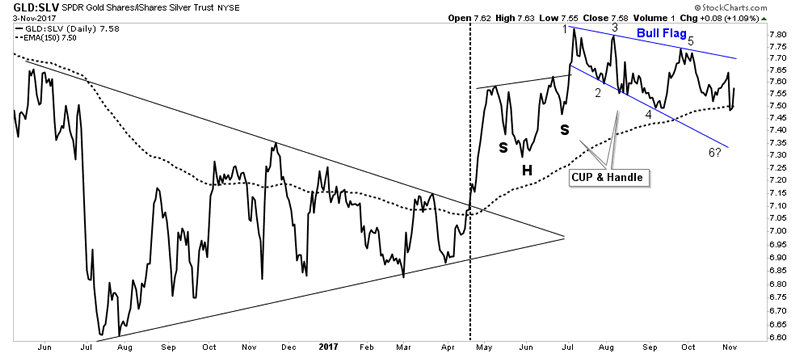
GSR- Update
We don’t expect a breakout until after a market peak is in place, however it continues to progress doing it’s technical work:
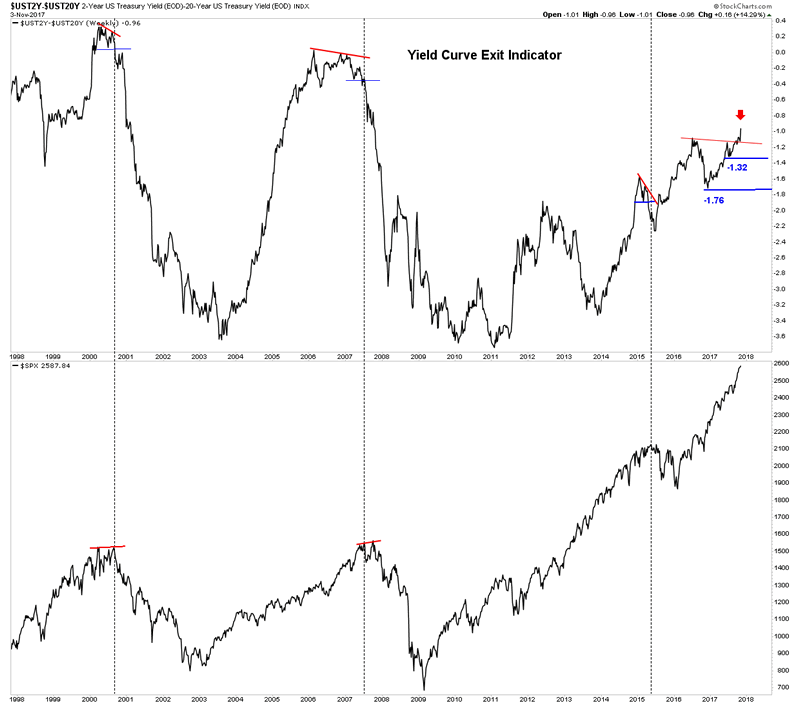
Yield Curve Exit Indicator:
It is saying don’t exit yet despite these initial internal indicators deteriorating.
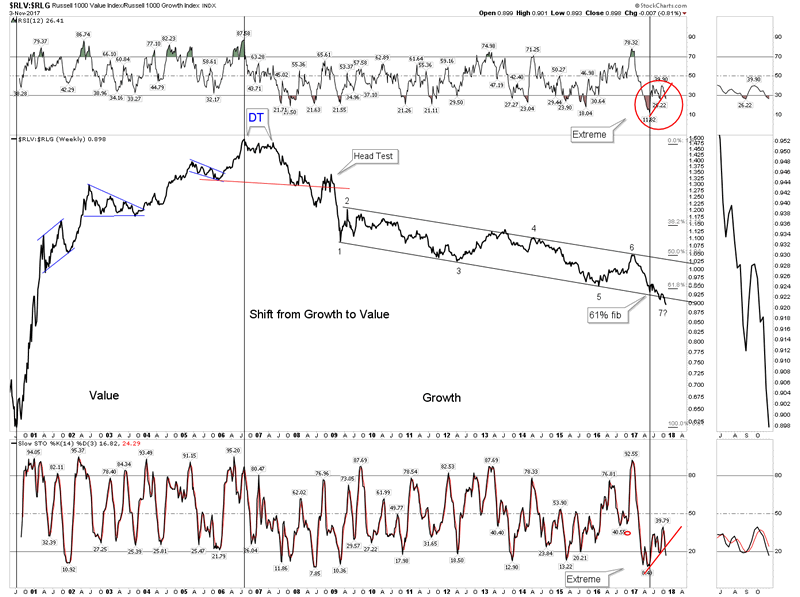
Value vs Growth indicator:
This chart indicates the market preference for growth over value continues even though it is extremely stretched
Bottom Line stock market– Stay the course if you are long, however the market is screaming it is in final blow off mode. Be careful and know that eventually you will need to exit to protect your capital.
The New FED Chair– Say Hello to the New Boss- Same as the Old Boss.
Peter Townsend would be proud of Trump’s pick this week of Jerome Powell as the new FED head. There had been hope of a libertarian disruptor to the established order, but the reality turned that hope into a pipe dream… of course. What this appointment assures is the money printing will continue and Wall Street will be assured of a bailout when the next crisis arrives. The Greenspan/Bernanke/Yellen legacy will be maintained and the Everything Bubble will continue to be pumped if it ever shows signs of deflating.
It is important to know where this man came from. He was a partner at the Carlisle Group, private equity firm. Their business model of course is using cheap capital to perform acquisitions. Their model is a classic case of mal-investment since these “deals” are not driven by consumer demand but are enabled by leveraging-up a balance sheet and “playing” the difference between their cost of capital and the markets cost. So the acquisitions they do are not due to business innovation, but instead from financial engineering. A recent example of this process completing the full circle is Toys “R” Us.
To understand Powell’s perspective and his understanding of economics this is all you really need to know. It will ultimately be all about saving his Wall Street friends whenever the next financial crisis arrives. The libertarian dream of disrupting the crony system of bailouts is not going to happen- meet the new boss!
Plunger
Copyright © 2017 Plunger - All Rights Reserved
All ideas, opinions, and/or forecasts, expressed or implied herein, are for informational purposes only and should not be construed as a recommendation to invest, trade, and/or speculate in the markets. Any investments, trades, and/or speculations made in light of the ideas, opinions, and/or forecasts, expressed or implied herein, are committed at your own risk, financial or otherwise. The information on this site has been prepared without regard to any particular investor’s investment objectives, financial situation, and needs. Accordingly, investors should not act on any information on this site without obtaining specific advice from their financial advisor. Past performance is no guarantee of future results.
© 2005-2022 http://www.MarketOracle.co.uk - The Market Oracle is a FREE Daily Financial Markets Analysis & Forecasting online publication.


