


Crude Oil – Gold Link in November 2017
Commodities / Crude Oil Nov 17, 2017 - 12:17 PM GMTBy: Nadia_Simmons

 In recent weeks, it was hard to avoid the topic of crude oil, turning on the TV or opening a newspaper. Developments in the Middle East, escalating tensions between Saudi Arabia and Iran, the upcoming meeting of OPEC and non-OPEC ministers as well as the Baker Hughes reports, crude oil and its products inventories were mainly in the interest of investors.
Since our last Oil Investment Update, light crude extended gains and hit fresh 2017 highs. Black gold’s rally, which began in early October, has been mainly driven by growing indications that the crude market was finally starting to rebalance and hopes that the OPEC cuts agreement would be extended beyond March 2018.
Thanks to these circumstances, the price of the commodity almost touched the level of $58, which increased the probability of the test of the barrier of $60 in the previous week. Despite geopolitical tensions, which usually support the price of black gold, light crude stopped its rally after an unexpected increase in crude oil inventories. Additionally, Friday Baker Hughes report showed that the number of oil rigs operating in the U.S. rose by 9 to 738, which was the highest level in almost a month.
And speaking of the drilling activity… As you remember, in May, OPEC producers agreed to extend production cuts until March 2018, but what happened with the number of oil rigs operating in the U.S. since then? They increased from 703 in May to 768 in August. Although we saw “declines” in the following weeks, the last week’s rebound raised worries amid investors that the U.S. oil producers are preparing to increase the output levels further and pushed the price of light crude lower.
Will we see further declines and a comeback to the barrier of $50 in the following week(s)? Or maybe oil bulls will stop their opponents and test the level of $60? Is it possible that the relationship between crude oil and gold will give us clues about black gold future moves? Let’s jump right into the charts (charts courtesy of http://stockcharts.com) and try to find out what can we expect in the coming weeks.
Let’s start today’s analyze with the long-term chart of the oil-to-gold ratio.
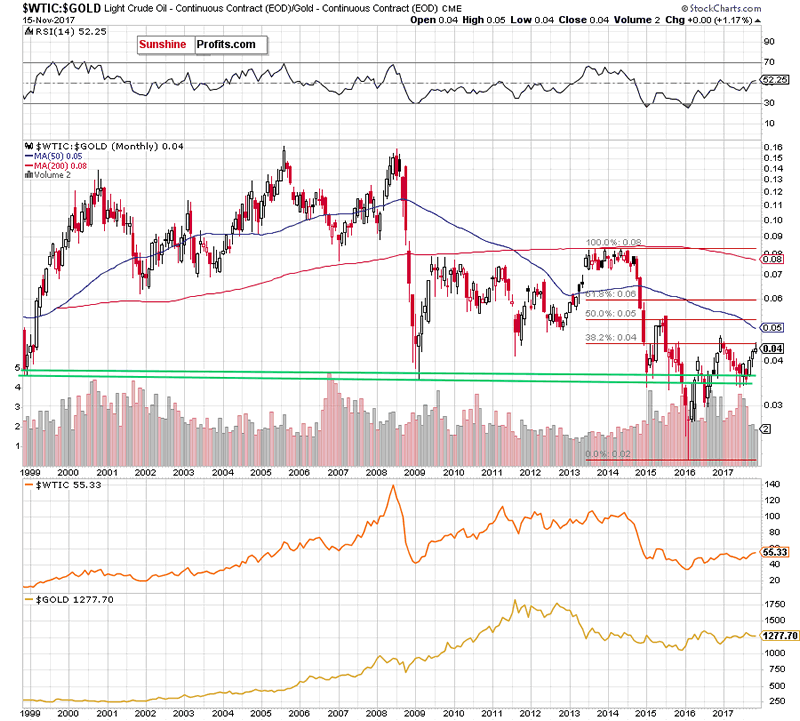
As you see on the above chart, the ratio extended gains, which resulted in a climb to the 38.2% Fibonacci retracement earlier this month. What does it suggests? As you know from our earlier alerts, this is the first important retracement, which usually is strong enough to stop or (at least) pause bulls. Therefore, the recent price action suggests that we could see a reversal and declines – similarly to what we saw at the beginning of the year.
Additionally, when we focus on the medium-term chart below, we can see some more bearish signs.
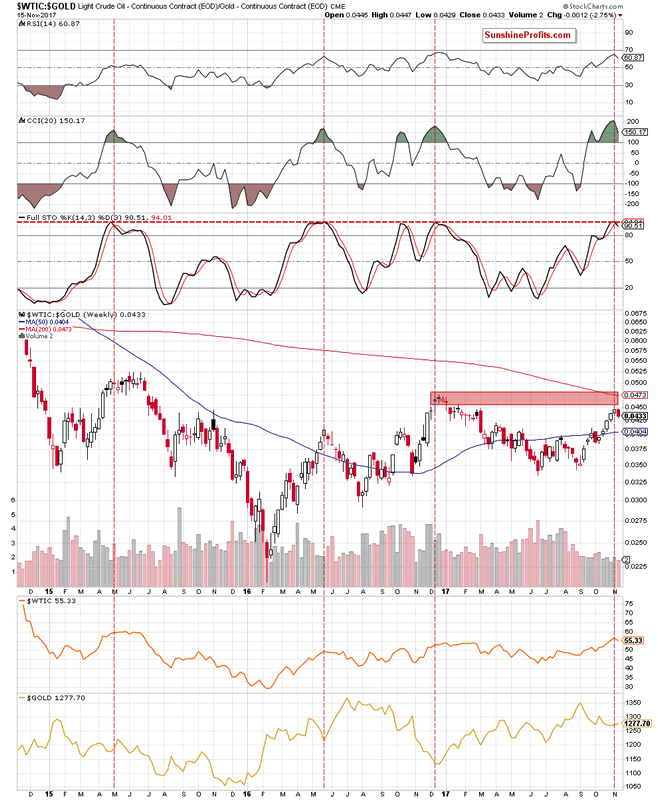
Firstly, similarly to what we wrote in the case of the long-term chart of crude oil itself, recent white candlesticks created in the previous weeks were getting smaller, which suggests that the power of buyers is decreasing and reversal in the near future should not surprise us – especially when we factor in the proximity to the red resistance zone created not only by the above-mentioned Fibonacci retracement, but also by the January highs.
Additionally, the Stochastic Oscillator generated the sell signal, giving the bears another reason to act. Since we are already here with this indicator, we would like to draw your attention to several similar situations to the current one. As you see on the above chart, there are red dashed horizontal and vertical lines marked on the indicator, which point to its highest levels since May 2015. What’s interesting in all these cases such high readings of the indicator preceded bigger moves to the downside. Therefore, in our opinion, the probability that we’ll see reversal and declines in not far future is very likely.
What does it mean for crude oil? As you see on the above charts, there is a positive correlation between the oil-to-gold ratio and crude oil which means that if it reverses and declines, it will likely translate into lower prices of crude oil in the coming week(s) – similarly to what we saw in the previous months.
If you enjoyed the above analysis and would like to receive free follow-ups, we encourage you to sign up for our daily newsletter – it’s free and if you don’t like it, you can unsubscribe with just 2 clicks. If you sign up today, you’ll also get 7 days of free access to our premium daily Oil Trading Alerts as well as Gold & Silver Trading Alerts. Sign up now.
Nadia Simmons
Forex & Oil Trading Strategist
Przemyslaw Radomski
Founder, Editor-in-chief
Sunshine Profits: Gold & Silver, Forex, Bitcoin, Crude Oil & Stocks
Stay updated: sign up for our free mailing list today
* * * * *
Disclaimer
All essays, research and information found above represent analyses and opinions of Nadia Simmons and Sunshine Profits' associates only. As such, it may prove wrong and be a subject to change without notice. Opinions and analyses were based on data available to authors of respective essays at the time of writing. Although the information provided above is based on careful research and sources that are believed to be accurate, Nadia Simmons and his associates do not guarantee the accuracy or thoroughness of the data or information reported. The opinions published above are neither an offer nor a recommendation to purchase or sell any securities. Nadia Simmons is not a Registered Securities Advisor. By reading Nadia Simmons’ reports you fully agree that he will not be held responsible or liable for any decisions you make regarding any information provided in these reports. Investing, trading and speculation in any financial markets may involve high risk of loss. Nadia Simmons, Sunshine Profits' employees and affiliates as well as members of their families may have a short or long position in any securities, including those mentioned in any of the reports or essays, and may make additional purchases and/or sales of those securities without notice.
© 2005-2022 http://www.MarketOracle.co.uk - The Market Oracle is a FREE Daily Financial Markets Analysis & Forecasting online publication.