


Retail Industry Index Providing The Next Stocks Long
Companies / Retail Sector Nov 28, 2017 - 01:28 PM GMT

 The S&P Retail Industry Index comprises stocks in the S&P Total Market Index that are classified in the GICS retail sub-industry. For this article we’ll be using The SPDR S&P Retail ETF (XRT) which tracks an equal-weighted index of stocks in the US retail industry and correspond generally to the total return performance of the S&P Retail Select Industry Index.
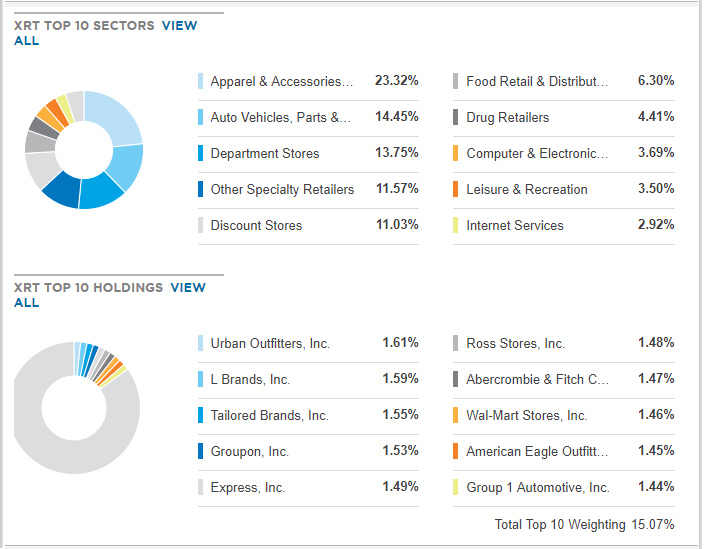
The performance of XRT is significantly correlated to the prevailing level of consumer confidence in the economy because the ETF represent the companies whose main business is selling retail merchandise to consumers like WalMart , Groupon, American Eagle, ect.
XRT Sectors and Holdings
To understand the current situation for the Index we need to take a look at the bigger picture since the recent recession after the 2008 Crash :
Retail Industry Index ETF ‘XRT’ Weekly Chart
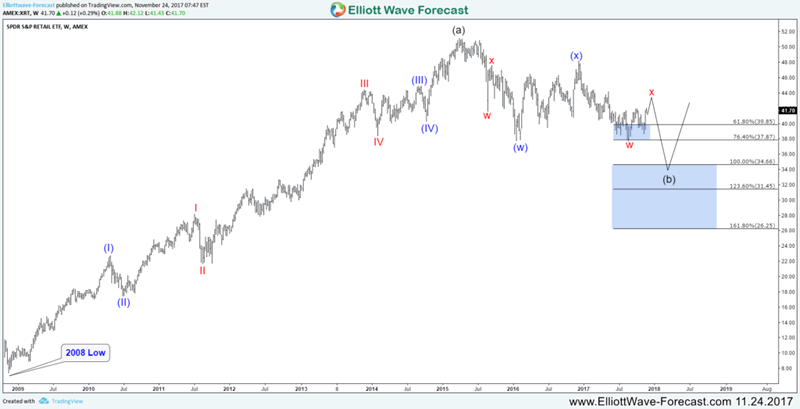
The ETF Rallied strongly from it’s 2008 low showing an impulsive 5 waves advance that ended at 2015 pea. Since then, the Index started wasn’t able to rally to new highs similar to the majority of sectors in the stock market.
XRT currently is still correcting the cycle from 2008 low and looking to do a double three structure toward 100% – 123.6% Fibonacci extension area 34 – 31 where it can find buyers for a move to new highs or at least 3 waves bounce.
How can we use the weakness in the retail index to our favor ?
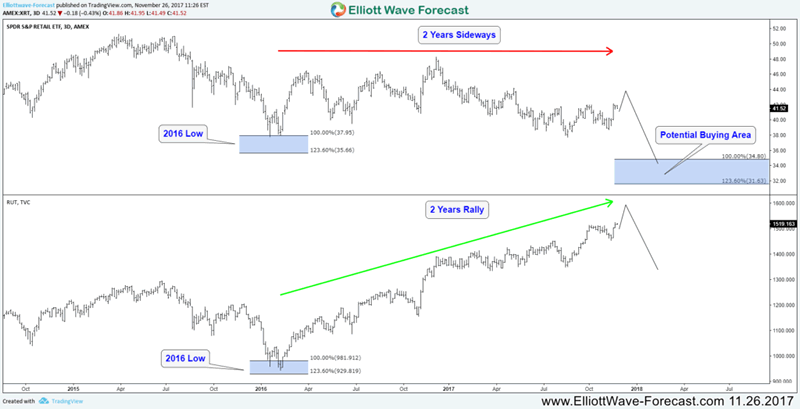
The world financial market is all correlated together and every instrument is related to each other in different dimension. In our next chart we can see how XRT and RUSSEL Index are sharing the same 2016 low which was a buying opportunity around the market as the majority of Indexes rallied to new highs from.
The rally around the world is still in progress almost for 2 years now while the retail industry index remained in a sideways range during that time. As the instrument has a corrective structure taking place then we can use the extreme area to know where the next buying opportunity will take place.
Russel (RUT) VS Retail Industry Index (XRT)
The rally in the stock market is far from ending but correction do take place, that why we use different tools like distribution system , pivots , cycles and correlation to help us identify the right time to switch and look for the next opportunity.
Some of clearest instruments that guide investors around the market in these conditions is the clear structure in Apple (AAPL) and NASDAQ (NQ_F) as both are leading the move to the upside. However as the market is bullish it’s always the wrong call to call a top against the trend as extension can always accrue in the strongest instruments, therefore it’s better to use a weak element in the market like XRT to identify where the bounce can fail and combined with the rest of tools to get a perfect match.
Retail Industry Index ETF ‘XRT’ Weekly Chart
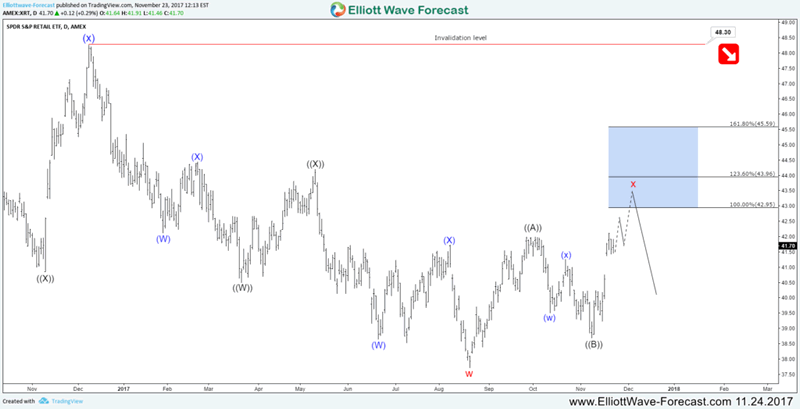
The retail industry ETF ‘XRT’ is currently showing an incomplete 5 swings bearish sequence from 2015, which is part of 7 swings corrective structure and consequently we expect the ETF to keep fail lower as long as the pivot at December 20016 peak (48.3) is holding.
The current 3 waves bounce in XRT is looking to reach extreme area 42.95 – 45.59 where we expect sellers to appear, therefore around that area the stock market would find a short term peak and start at least a 3 waves correction to the downside.
Recap
The majority of retail traders are trying to Time the Peak in Stock Market to get in short side while the big players are looking for the next pullback to take place so they can add more Longs. Using an ETF like XRT to trade to short side and hedge your portfolio during market correction is a far better trade then trying to short Apple or Nasdaq.
If you’re interested in getting more insights about buying opportunities in the Stock Market then take this opportunity and try our services 14 days to learn how to trade Stocks and ETFs using our blue boxes and the 3, 7 or 11 swings sequence. You will get access to our 78 instruments updated in 4 different time frames, Live Trading & Analysis Session done by our Expert Analysts every day, 24-hour chat room support and much more.
By Ayoub Ben Rejeb
https://elliottwave-forecast.com
ElliottWave-Forecast has built its reputation on accurate technical analysis and a winning attitude. By successfully incorporating the Elliott Wave Theory with Market Correlation, Cycles, Proprietary Pivot System, we provide precise forecasts with up-to-date analysis for 52 instruments including Forex majors & crosses, Commodities and a number of Equity Indices from around the World. Our clients also have immediate access to our proprietary Actionable Trade Setups, Market Overview, 1 Hour, 4 Hour, Daily & Weekly Wave Counts. Weekend Webinar, Live Screen Sharing Sessions, Daily Technical Videos, Elliott Wave Setup .
Copyright © 2017 ElliottWave-Forecast - All Rights Reserved Disclaimer: The above is a matter of opinion provided for general information purposes only and is not intended as investment advice. Information and analysis above are derived from sources and utilising methods believed to be reliable, but we cannot accept responsibility for any losses you may incur as a result of this analysis. Individuals should consult with their personal financial advisors.
© 2005-2022 http://www.MarketOracle.co.uk - The Market Oracle is a FREE Daily Financial Markets Analysis & Forecasting online publication.