Stock Market Tops Look Like This
Stock-Markets / Stock Market 2017 Dec 07, 2017 - 03:55 PM GMTBy: Enda_Glynn
 The signs of crazed speculation just keep pouring in these days.
We another Doozie from the Bloomberg wire today!
TD Ameritrade tracks its clients inflows and outflows from retail accounts on a monthly basis.
you can follow it here
November saw the largest inflow into stocks in the index's history,
surging the index to a new all time high.
their statement was even more noteworthy;
“The retail investor has become a bit more of a believer,
We don’t want people to get overzealous, if you will.
This is controlled exuberance.”
Did you ever hear the term 'Dumb money'?
Well,
That is the term used in the industry for retail investors!
The reason they are referred to as dumb money is because the typical retail investor usually dives in at exactly the wrong time.
Now,
Dumb money just went 'all in' for stocks
when the main index's are sitting at historically overvalued, overbought and over bullish extremes!
Good Lord,
There is no such thing as controlled exuberance!
Be aware,
Stock market tops look like this!
Now down to business.
TOMORROWS RISK EVENTS:
USD: Unemployment Claims.
EUR: ECB President Draghi Speaks.
GBP: Halifax HPI m/m.
JPY: Final GDP q/q.

My Bias: market topping process completing
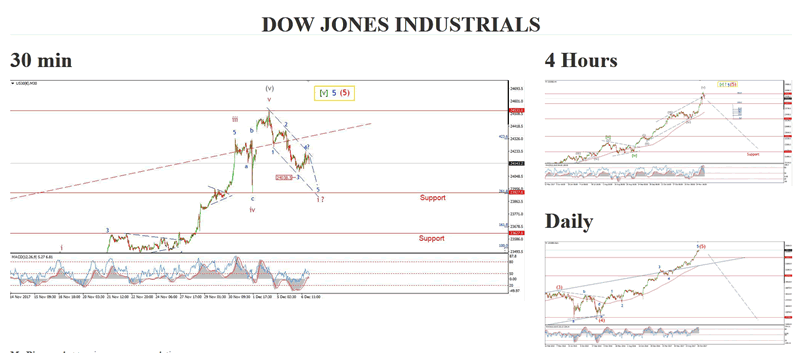
Wave Structure: Impulsive 5 wave structure, topping in an all time high.
Long term wave count: topping in wave (5)
The DOW seems to have corrected higher today,
the price move was overlapping as a correction should be and should be followed by a decline in wave '5' blue.
The wave form off the high is developing quite nicely so far although it is very early days in this downturn.
Initial support lies at 23927, the low of the previous wave 'iv' pink.
A cross below this level will add weight to the short term bearish case.
The developing downside structure,
coupled with the sentiment extreme I wrote about at the beginning,
All fit well with the idea of a topping market.
For tomorrow;
watch for a decline into the trendline to complete a five wave structure off the high.
at that point I will look for a three wave corrective rally to complete an Elliott wave signal off the high.

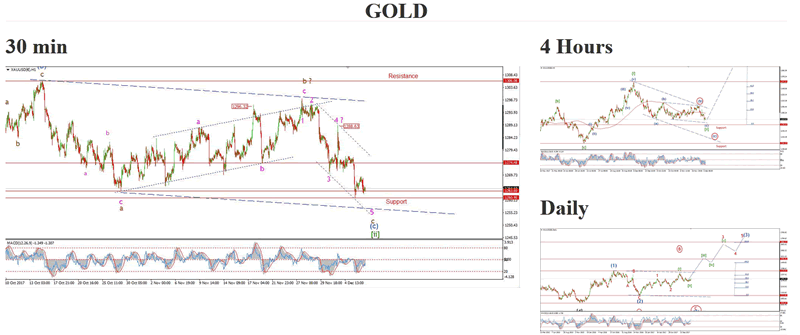
My Bias: Long to a new all time high above 1827.
Wave Structure: Impulse structure to a new high.
Long term wave count: wave (3) above 1666.
GOLD has remained fairly flat today,
Which adds to the idea that wave '5' pink is still unfolding.
Support at 1260 is holding the price for now,
But I expect we will see one more drop below that level into the lower trendline at 1255 which should complete the decline.
4hr momentum is now rising off the low and will shortly create a positive divergence form the price.
I will wait to see a clear bullish centreline cross to shift to a bullish stance in the short term.
For tomorrow;
watch for price to decline into the lower trendline at 1255 to complete wave 'c' brown.
If you want to be ready for the next opportunity in Crude, Gold, The DOW and the USD FX markets,
Check out the membership offers and stay on top of the price action!
BULLWAVES MEMBERSHIP
Enda Glynn
http://bullwaves.org
I am an Elliott wave trader,
I have studied and traded using Elliott wave analysis as the backbone of my approach to markets for the last 10 years.
I take a top down approach to market analysis
starting at the daily time frame all the way down to the 30 minute time frame.
© 2017 Copyright Enda Glynn - All Rights Reserved
Disclaimer: The above is a matter of opinion provided for general information purposes only and is not intended as investment advice. Information and analysis above are derived from sources and utilising methods believed to be reliable, but we cannot accept responsibility for any losses you may incur as a result of this analysis. Individuals should consult with their personal financial advisors.
© 2005-2022 http://www.MarketOracle.co.uk - The Market Oracle is a FREE Daily Financial Markets Analysis & Forecasting online publication.


