


The Dow Gold Ratio
Commodities / Gold and Silver 2017 Dec 11, 2017 - 08:42 AM GMT

 This next set of ratio charts I consider to be the most important ratio charts if you are deciding whether to be an investor in the INDU or in Gold.
When the price is rising The INDU ( Dow Jones Industrial Average ) (a proxy for General Stock Markets) is rising against Gold , and when it is falling Gold is rising against the Dow.
This first ratio chart for the INDU:Gold is a daily look which shows the ratio breaking out above the top rail of a bullish rising flag with a completed backtest. It doesn’t look that impressive on a daily chart, but when we look at the longer term ratio chart it becomes very important.
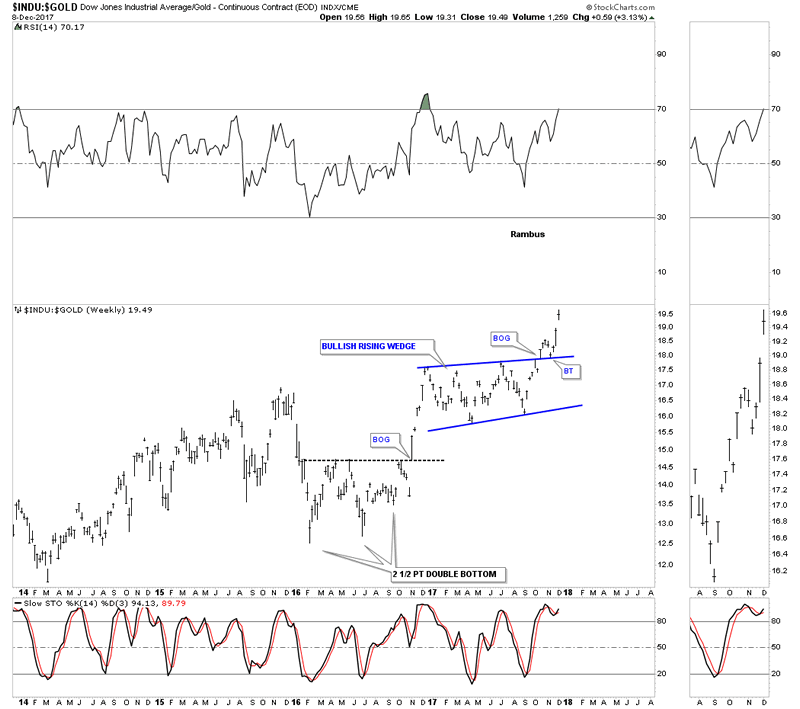
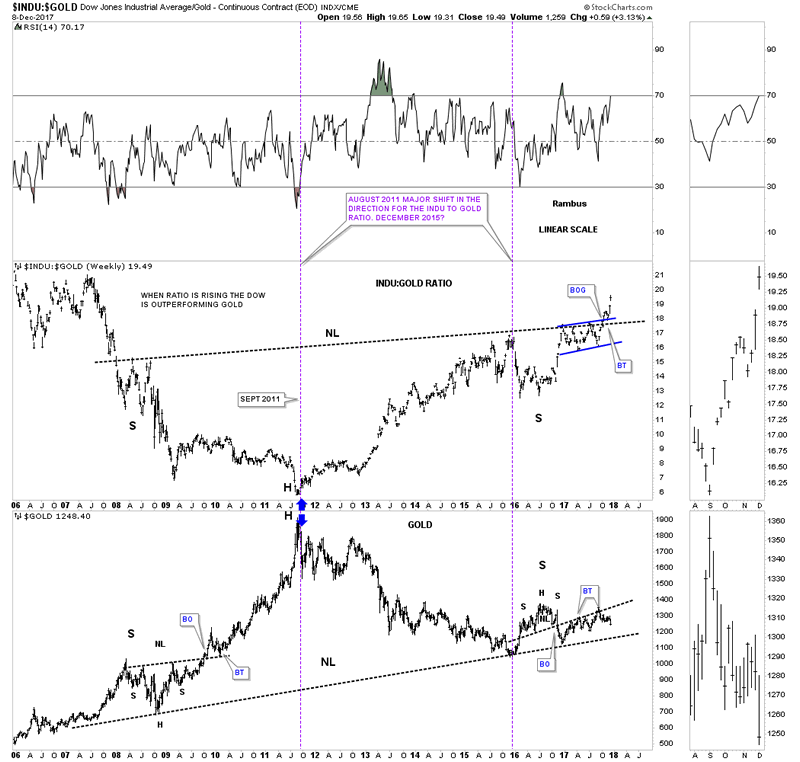
Below is a long term 10 year weekly chart which shows a massive H&S bottom on the ratio chart on top and a possible massive H&S top on gold on the bottom chart. Note how the blue bullish rising flag formed just below the neckline on the ratio chart which has given the ratio chart the energy it needed to finally breakout. I’ve been showing this ratio combo chart for a long time now so the breakout above the neckline is falling into place.
Below is a 38 year daily line chart for the INDU:gold ratio chart which puts the very big picture in perspective. This ratio chart tells you when you need to be trading in the INDU and out of Gold and visa versa. As you can see you wanted to be trading in the INDU going into the 2000 bubble top and out of gold. In 2000 that all changed. From that point forward you wanted to be trading in the PM sector staying away from the INDU.
There are many gold investors that swear that the ratio has to go as low a 1 to 1 before the gold bull market is over. As you can see the ratio got as low as 5.5 in 2011 which is close enough IMHO especially since the price action that followed that double bottom low. There is a massive H&S bottom with the breakout underway. We have a very clear line in the sand for the staunch gold bulls which is the neckline. As long as the price action trades above that neckline the INDU is going to outperform gold.
As the breakout is just now taking place this ratio could rise for many years to come regardless of all the reasons it can’t. I will have no problem reversing my stance if I see the neckline is broken to the downside, but until it is I have to give the ratio chart the benefit of a doubt. 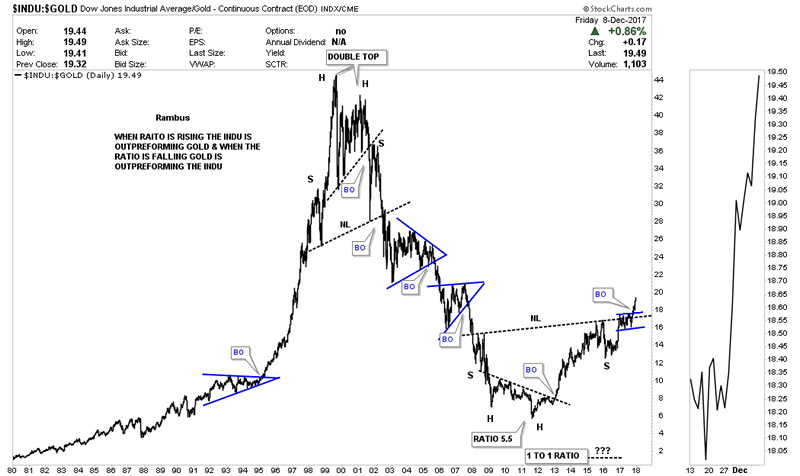
All the best
Gary (for Rambus Chartology)
FREE TRIAL - http://rambus1.com/?page_id=10
© 2017 Copyright Rambus- All Rights Reserved
Disclaimer: The above is a matter of opinion provided for general information purposes only and is not intended as investment advice. Information and analysis above are derived from sources and utilising methods believed to be reliable, but we cannot accept responsibility for any losses you may incur as a result of this analysis. Individuals should consult with their personal financial advisors.
© 2005-2022 http://www.MarketOracle.co.uk - The Market Oracle is a FREE Daily Financial Markets Analysis & Forecasting online publication.