Most Popular
1. It’s a New Macro, the Gold Market Knows It, But Dead Men Walking Do Not (yet)- Gary_Tanashian
2.Stock Market Presidential Election Cycle Seasonal Trend Analysis - Nadeem_Walayat
3. Bitcoin S&P Pattern - Nadeem_Walayat
4.Nvidia Blow Off Top - Flying High like the Phoenix too Close to the Sun - Nadeem_Walayat
4.U.S. financial market’s “Weimar phase” impact to your fiat and digital assets - Raymond_Matison
5. How to Profit from the Global Warming ClImate Change Mega Death Trend - Part1 - Nadeem_Walayat
7.Bitcoin Gravy Train Trend Forecast 2024 - - Nadeem_Walayat
8.The Bond Trade and Interest Rates - Nadeem_Walayat
9.It’s Easy to Scream Stocks Bubble! - Stephen_McBride
10.Fed’s Next Intertest Rate Move might not align with popular consensus - Richard_Mills
Last 7 days
Stocks, Bitcoin, Gold and Silver Markets Brief - 18th Feb 25
Harnessing Market Insights to Drive Financial Success - 18th Feb 25
Stock Market Bubble 2025 - 11th Feb 25
Fed Interest Rate Cut Probability - 11th Feb 25
Global Liquidity Prepares to Fire Bull Market Booster Rockets - 11th Feb 25
Stock Market Sentiment Speaks: A Long-Term Bear Market Is Simply Impossible Today - 11th Feb 25
A Stock Market Chart That’s Out of This World - 11th Feb 25
These Are The Banks The Fed Believes Will Fail - 11th Feb 25
S&P 500: Dangerous Fragility Near Record High - 11th Feb 25
Stocks, Bitcoin and Crypto Markets Get High on Donald Trump Pump - 10th Feb 25
Bitcoin Break Out, MSTR Rocket to the Moon! AI Tech Stocks Earnings Season - 10th Feb 25
Liquidity and Inflation - 10th Feb 25
Gold Stocks Valuation Anomaly - 10th Feb 25
Stocks, Bitcoin and Crypto's Under President Donald Pump - 8th Feb 25
Transition to a New Global Monetary System - 8th Feb 25
Betting On Outliers: Yuri Milner and the Art of the Power Law - 8th Feb 25
President Black Swan Slithers into the Year of the Snake, Chaos Rules! - 2nd Feb 25
Trump's Squid Game America, a Year of Black Swans and Bull Market Pumps - 24th Jan 25
Japan Interest Rate Hike - Black Swan Panic Event Incoming? - 23rd Jan 25
It's Five Nights at Freddy's Again! - 12th Jan 25
Squid Game Stock Market 2025 - 5th Jan 25

Market Oracle FREE Newsletter

How to Protect your Wealth by Investing in AI Tech Stocks

Another Technical Tool in the Markets Chart Analysis Toolbox!

InvestorEducation / Technical Analysis Dec 22, 2017 - 12:31 PM GMT

By: Peter_Degraaf

InvestorEducation

Charts are fascinating!  They reflect human action.  We look at charts for direction, for support and resistance.  Here is a chart (courtesy Stockcharts.com) that is just now in the process of showing a buy signal for gold mining stocks.


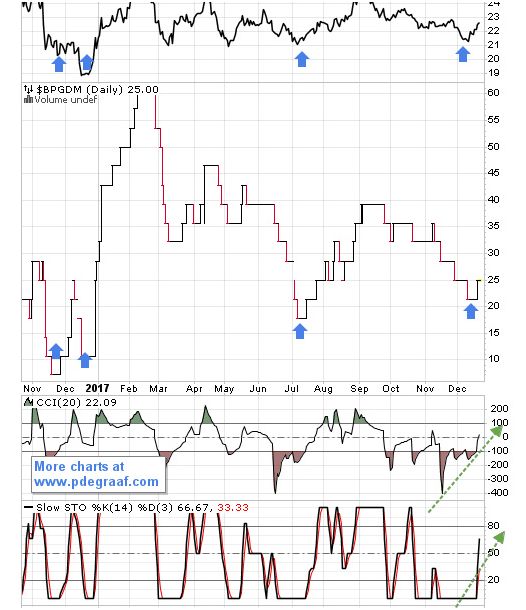
Featured is $BPGDM.  This index rises or falls according to the bullish percentage among the stocks that make up the index.  At the top we have inserted GDX, the miners ETF.  In the past, whenever $BPGDM rose up from below 25 it gave a buy signal for mining stocks.  Notice how the blue arrows point to excellent timing.  The supporting indicators at the bottom (CCI and Slow Sto) have just turned positive, to provide confirmation.

Peter Degraaf is NOT responsible for your trading decisions.  Please do your own due diligence. 

By Peter Degraaf

Peter Degraaf is an on-line stock trader with over 50 years of investing experience. He issues a weekend report on the markets for his many subscribers. For a sample issue send him an E-mail at itiswell@cogeco.net , or visit his website at www.pdegraaf.com where you will find many long-term charts, as well as an interesting collection of Worthwhile Quotes that make for fascinating reading.

© 2017 Copyright Peter Degraaf - All Rights Reserved

DISCLAIMER:Please do your own due diligence.  Investing involves taking risks.  I am not responsible for your investment decisions.

Peter Degraaf Archive

© 2005-2022 http://www.MarketOracle.co.uk - The Market Oracle is a FREE Daily Financial Markets Analysis & Forecasting online publication.


Post Comment

Only logged in users are allowed to post comments. Register/ Log in