


More Important Than Gold’s Bottoming Price
Commodities / Gold and Silver 2018 Jan 09, 2018 - 10:02 AM GMTBy: P_Radomski_CFA

 Time is more important than price. That’s what we – investors – are often made to believe regarding the future price movement. And rightfully so. The price could reach a bottom several dollars ahead of the predicted price target or it could break through it, leaving investors wondering, if there was a breakdown and thus they should expect to see another big downswing shortly. With time, things are clearer. The time for a given move is up and the price reverses. When is gold likely to finally bottom?
Between August and October 2018. That’s the most up-to-date estimate based on the data that we have right now. Here’s why (charts courtesy of http://stockcharts.com).
In the previous weeks and months, we wrote on multiple occasions why the current situation is similar to the 2012-2013 top and subsequent decline, so we don’t want to go into details once again today. Instead, we want to focus on the size of the follow-up action in terms of price and time.
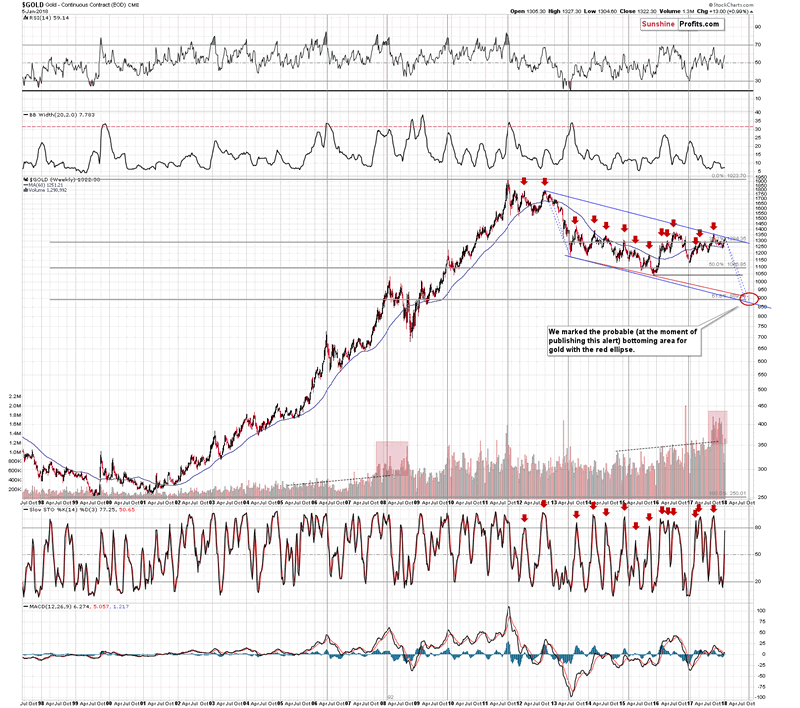
When gold topped above $1,350 in early September 2017, it seemed that the decline might have started. This might have indeed been the case, but the pace at which gold has moved lower up to today is different. It was sharper in 2012. Consequently, perhaps looking at the decline from the late-2012 top to the 2013 bottom and applying it to the September 2017 top in order to estimate the time and price of the upcoming bottom is not the best approach.
It might be better to start the analogy with the second top of the decline – the November 2012 top. At the same time, we should take into account the scenario in which gold follows the entire 2012-2013 decline, but the current starting point should be the current top, not the September 2017 one.
Both mentioned analogies are visible on the above chart in the form of the blue dashed lines. They point to a bottom in August or in late September (perhaps early October).
The latter is more probable because of another important factor that points to this timeframe. The long-term cyclical turning point.
Until the 2011 top, all long-term turning points in gold marked major interim high and after that all of them marked interim bottoms. This also includes the 2013 bottom.
The next of the long-term turning points is to be seen in late September 2017, which perfectly fits the mentioned analogies.
Let’s move back to the shape of the declines and their size in terms of price. The price that gold is likely to reach in the second half of this year is a bit below $900 – which is in tune with the 61.8% Fibonacci retracement level and the lower border of the declining trend channel.
Speaking of the trend channel, please note that gold is almost at its upper border. Consequently, gold likely has very little room to move higher in the short term.
Before moving further, we would like to once again emphasize that the current situation is not only similar to the 2012-2013 performance, but also to the 2008 one. You can see the similarity for instance in the increase in the level of volume. This was the kind of performance that preceded one of the sharpest of gold’s declines in the past few decades. The implications are bearish.
There’s much more to the outlook for gold than just the analysis of the yellow metals’ price. Consequently, in today’s free analysis, we discuss one of the very little-known charts featuring the junior mining stocks to senior mining stocks ratio. The reason that we’re following it is that juniors tend to outperform seniors, further magnifying gold’s gains and, consequently, the ratio moves in tune with gold. This gives us the opportunity to check for divergences and to use the ratio to confirm gold’s direction.
The link between the price of gold and the ratio is far from being clear, which is probably why it’s something that’s under the radar of most investors and analysts. However, the link being unclear doesn’t mean that we can’t use it. Applying the RSI indicator allows us to detect the particularly important price movements.
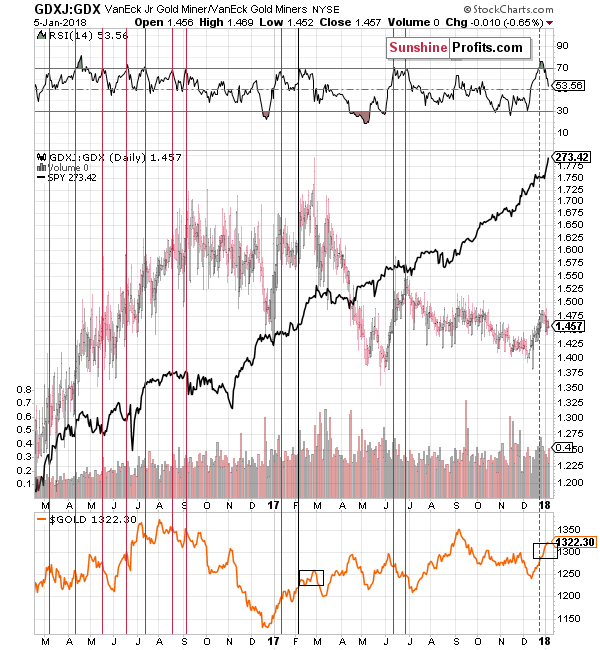
We previously featured the above chart in late 2017 and we wrote that in the majority of cases a move to the 70 level in the RSI was followed by a decline and thus the above chart had bearish implications. Even very likely doesn’t mean imminent and this time, the less likely outcome transpired. Gold moved higher, just like it was the case in one out of the 11 previous cases.
Why are we bringing this back today? In order to check if gold is performing in tune with the single session that turned out to be similar to the current performance.
It is. Back in February 2017, gold moved less than $40 higher after the signal (the RSI moving to 70) and we currently see something alike. The rally is a bit bigger right now, but very much in line with the past case. If the only similar session was followed by a rally that’s similar to the current one, then this rally might be over or about to be over.
There’s another way to look at similarities on the above chart. Instead of focusing on the RSI at 70, let’s check when was the last time the RSI moved to about 80, and what happened then. After all, that’s also what we saw recently. The above chart features only one similar case – April 2016. Interestingly, back then, gold moved higher by about $40+ before topping. If history is to repeat itself, gold has either topped or is about to form a top shortly.
The medium-term outlook for the precious metals market remains bearish as confirmed by multiple factors, and based on the most recent short-term factors, it seems that the corrective upswing in gold, silver and mining stocks is either over or close to being over. Gold’s critical performance in terms of the Japanese yen, situation in the Euro Index, and both key precious metals’ turning points support the above.
Summing up, even though gold’s upswing may seem encouraging to gold investors, it seems that it’s days are numbered based on many factors, including the performance of the juniors to seniors ratio. The true buying opportunity is likely to present itself this year, but most likely not in its first half. The period between August and October seems to be the most likely time-frame for the final bottom in the price of the yellow metal, with October being the more probable date. As far as the outlook for the price of gold in January is concerned, the situation appears bearish.
Naturally, the above is up-to-date at the moment of publishing it and the situation may – and is likely to – change in the future. If you’d like to receive follow-ups to the above analysis, we invite you to sign up to our gold newsletter. You’ll receive our articles for free and if you don’t like them, you can unsubscribe in just a few seconds. Sign up today.Thank you.
Przemyslaw Radomski, CFA
Founder, Editor-in-chief
Tools for Effective Gold & Silver Investments - SunshineProfits.com
Tools für Effektives Gold- und Silber-Investment - SunshineProfits.DE
* * * * *
About Sunshine Profits
Sunshine Profits enables anyone to forecast market changes with a level of accuracy that was once only available to closed-door institutions. It provides free trial access to its best investment tools (including lists of best gold stocks and best silver stocks), proprietary gold & silver indicators, buy & sell signals, weekly newsletter, and more. Seeing is believing.
Disclaimer
All essays, research and information found above represent analyses and opinions of Przemyslaw Radomski, CFA and Sunshine Profits' associates only. As such, it may prove wrong and be a subject to change without notice. Opinions and analyses were based on data available to authors of respective essays at the time of writing. Although the information provided above is based on careful research and sources that are believed to be accurate, Przemyslaw Radomski, CFA and his associates do not guarantee the accuracy or thoroughness of the data or information reported. The opinions published above are neither an offer nor a recommendation to purchase or sell any securities. Mr. Radomski is not a Registered Securities Advisor. By reading Przemyslaw Radomski's, CFA reports you fully agree that he will not be held responsible or liable for any decisions you make regarding any information provided in these reports. Investing, trading and speculation in any financial markets may involve high risk of loss. Przemyslaw Radomski, CFA, Sunshine Profits' employees and affiliates as well as members of their families may have a short or long position in any securities, including those mentioned in any of the reports or essays, and may make additional purchases and/or sales of those securities without notice.
Przemyslaw Radomski Archive |
© 2005-2022 http://www.MarketOracle.co.uk - The Market Oracle is a FREE Daily Financial Markets Analysis & Forecasting online publication.