


USD/CHF Under Long-term Support!
Currencies / Forex Trading Jan 25, 2018 - 02:23 PM GMTBy: Nadia_Simmons

Earlier today, the greenback declined to the lowest level against the Swiss franc since mid-September 2017, which resulted in a small drop under the long-term support line. Is this a sign of bigger move to the downside or just a trap?
EUR/USD
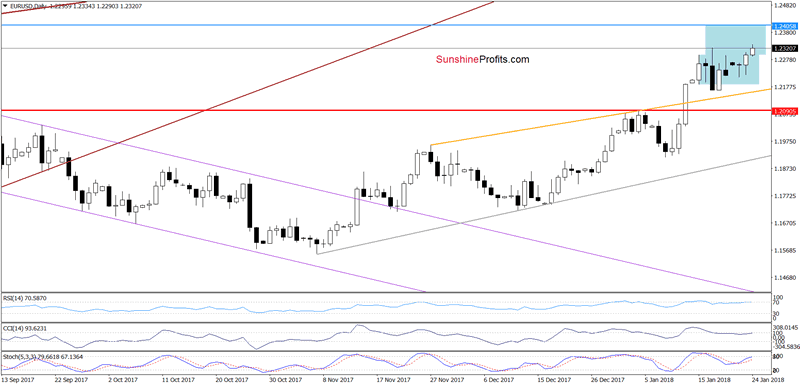
The first thing that catches the eye on the daily chart is a tiny breakout above the upper border of the blue consolidation and a fresh 2018 high. Although the size of the move is not impressive at the moment of writing these words, please note that the Stochastic Oscillator generated a buy signal, which suggests further improvement and a climb to at least 1.2405, where the size of the upswing will correspond to the height of the blue consolidation.
What could happen if currency bulls manage to push the exchange rate above this area?
Let’s take a closer look at the USD Index below.
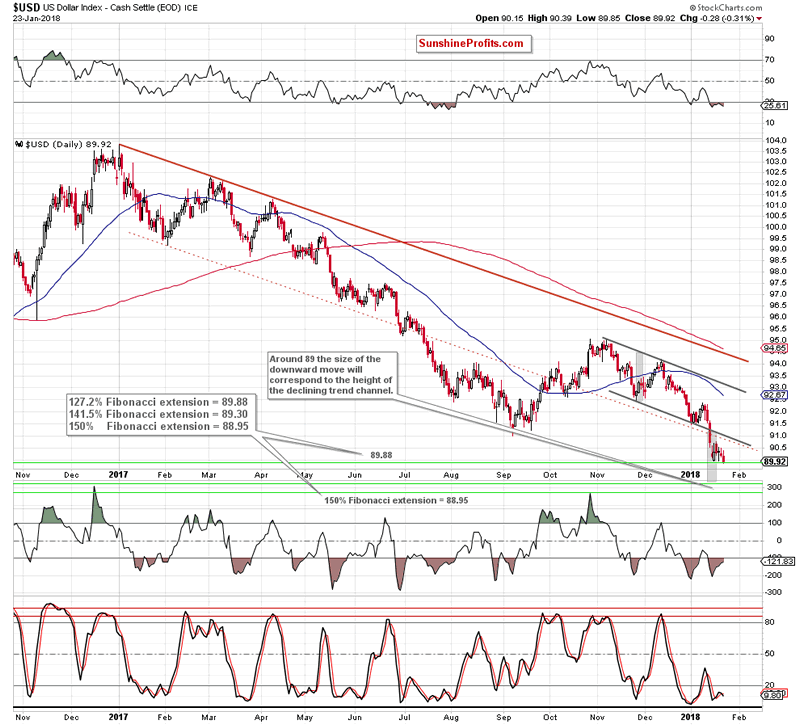
From this perspective, we see that bulls didn’t even manage to climb to the previously-broken lower border of the black declining trend channel, showing their weakness. This failure suggests that we could see a drop to around 89, where the size of the downward move will correspond to the height of the declining trend channel.
What could happen at the same time with EUR/USD?
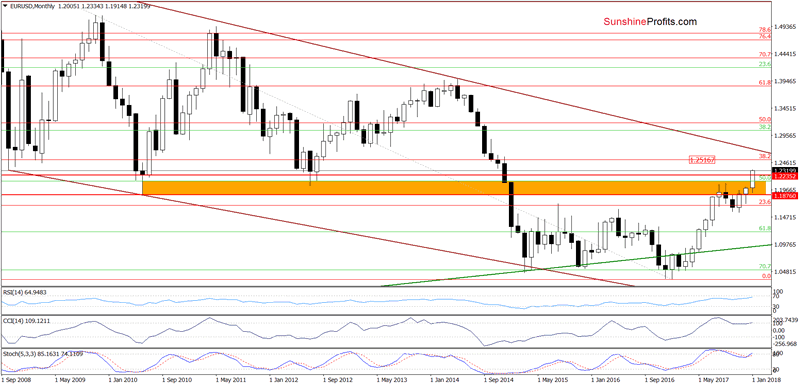
We think that such decline in the greenback could push the exchange rate to the 38.2% Fibonacci retracement based on the entire 2008-2017 downward move. Nevertheless, this is just a potential scenario and we will continue to monitor the market very closely in the coming days.
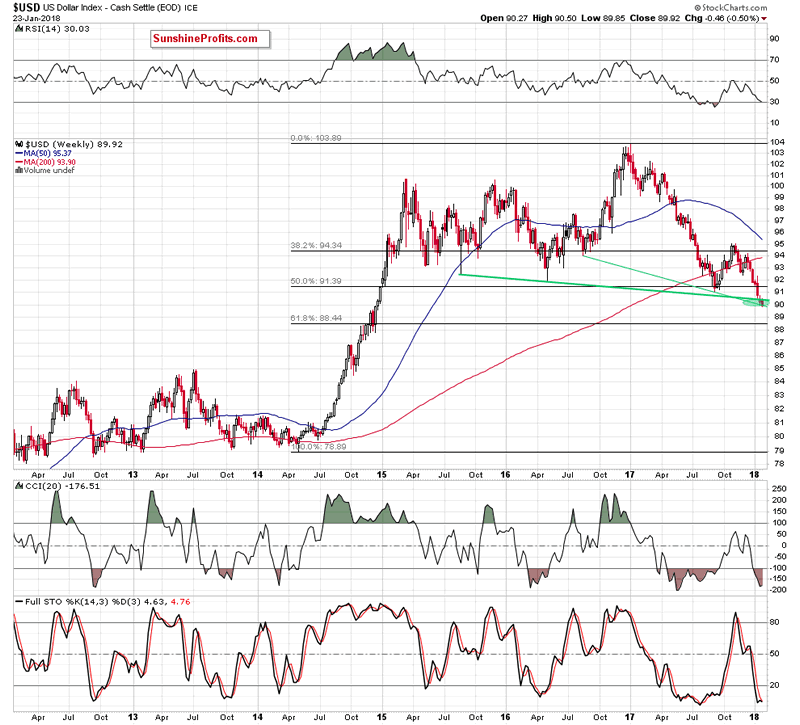
Finishing today’s alert, please note that if the support area around 89 doesn’t stop declines in the USD Index, the next downside target for the bears will be likely the 61.8% Fibonacci retracement (around 88.44) based on the entire 2014-2017 upward move).
USD/CHF
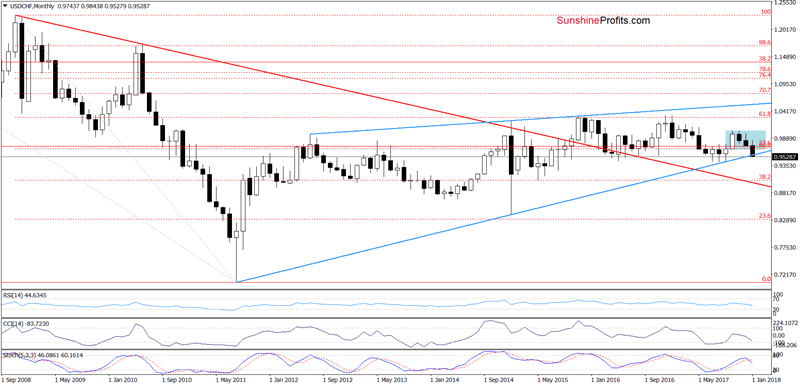
On the long-term chart, we see that USD/CHF slipped slightly below the long-term blue support line based on the previous important lows, which doesn’t bode well for currency bulls – especially when we factor in the sell signal generated by the Stochastic Oscillator.
On the other hand, not far from current levels there are July, August and September lows, which could pause further deterioration. Are there any other factors that could stop currency bears? Let’s take a look at the daily chart.
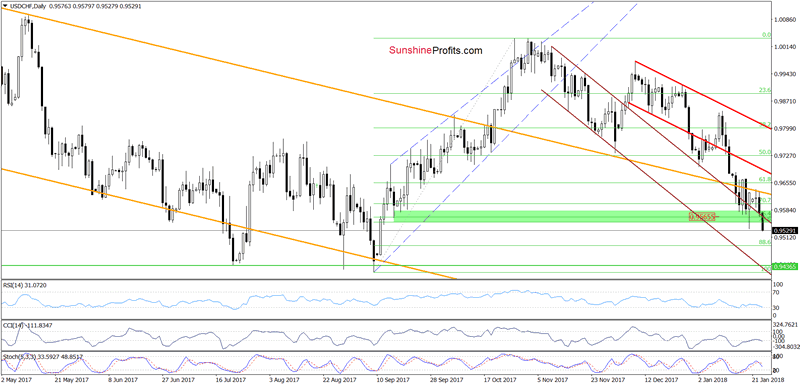
From today’s point of view, we see that although USD/CHF invalidated the breakdown under the upper border of the brown declining trend channel in the previous week, this improvement was only temporary and currency bulls didn’t manage to trigger further improvement.
As a result, the exchange rate came back under the above-mentioned line and slipped under the green support zone, which opened the way to the lower border of the brown declining trend channel, which currently intersects the support area created by the recent lows.
The pro bearish scenario is also reinforced by the current position of the indicators – the CCI invalidated the buy signal, while the Stochastic Oscillator generated the sell signal, supporting lower values of USD/CHF in the coming days.
AUD/USD
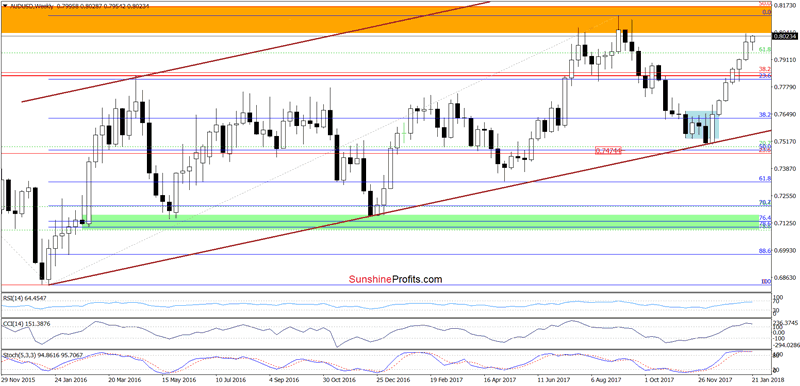
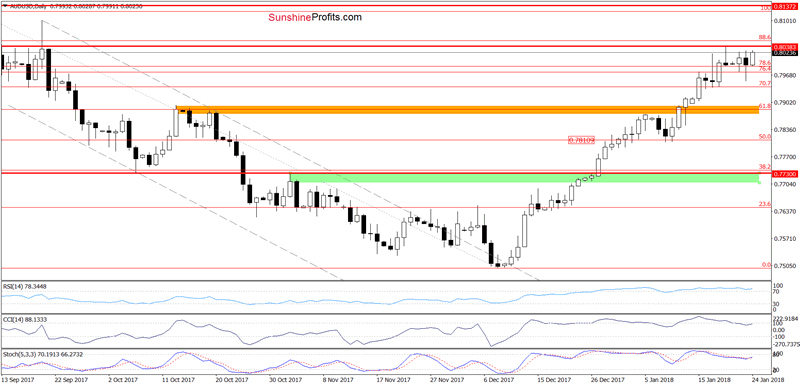
Yesterday, AUD/USD pulled back, which resulted in a comeback to slightly below the zone created by the 76.4% and 78.6% Fibonacci retracements. Despite this downswing, the pair moved higher earlier today, which suggests that we may see a test of the recent highs in the coming days. Nevertheless, please keep in mind that the orange resistance zone marked on the weekly chart stopped bulls two times in the past, therefore, if history repeats itself once again, we’ll likely see another reversal in this area.
If you enjoyed the above analysis and would like to receive free follow-ups, we encourage you to sign up for our daily newsletter – it’s free and if you don’t like it, you can unsubscribe with just 2 clicks. If you sign up today, you’ll also get 7 days of free access to our premium daily Oil Trading Alerts as well as Gold & Silver Trading Alerts. Sign up now.
Nadia Simmons
Forex & Oil Trading Strategist
Przemyslaw Radomski
Founder, Editor-in-chief
Sunshine Profits: Gold & Silver, Forex, Bitcoin, Crude Oil & Stocks
Stay updated: sign up for our free mailing list today
* * * * *
Disclaimer
All essays, research and information found above represent analyses and opinions of Nadia Simmons and Sunshine Profits' associates only. As such, it may prove wrong and be a subject to change without notice. Opinions and analyses were based on data available to authors of respective essays at the time of writing. Although the information provided above is based on careful research and sources that are believed to be accurate, Nadia Simmons and his associates do not guarantee the accuracy or thoroughness of the data or information reported. The opinions published above are neither an offer nor a recommendation to purchase or sell any securities. Nadia Simmons is not a Registered Securities Advisor. By reading Nadia Simmons’ reports you fully agree that he will not be held responsible or liable for any decisions you make regarding any information provided in these reports. Investing, trading and speculation in any financial markets may involve high risk of loss. Nadia Simmons, Sunshine Profits' employees and affiliates as well as members of their families may have a short or long position in any securities, including those mentioned in any of the reports or essays, and may make additional purchases and/or sales of those securities without notice.
© 2005-2022 http://www.MarketOracle.co.uk - The Market Oracle is a FREE Daily Financial Markets Analysis & Forecasting online publication.