Long-term Crude Oil Price Trend Analysis
Commodities / Crude Oil Sep 07, 2008 - 01:44 AM GMTBy: Richard_Shaw
 Where are oil prices going? We don't know. You don't know. Nobody knows. Short-term events could drive oil higher or lower. The current trend is clearly down, but where it stops is not evident.
What is an investor to do? One reasonable thing to do is nothing, if you don't have particular oil exposure, or if you have good yield from oil companies with well covered dividends.
When does increasing exposure make sense? That depends on your time horizon and the yield element. If you plan to use a futures-based investment products such as USO or OIL, you need to watch the charts fairly closely. If you you plan to buy large integrated oil companies with solid yields and strong financial conditions, such as Chevron (CVX), or an oil royalty trust such as Canadian Oil Sands (COSWF), now may not be a bad time, although there may be better entry points yet to come.
How low can oil prices go? They probably won't go below the “total production cost”‘ The problem is that number has an enormous range.
Total Production Cost includes the cost of finding and adding new reserves, plus the cost of lifting the oil, or the equivalent of lifting, for extraction from other materials, such as oil sands.
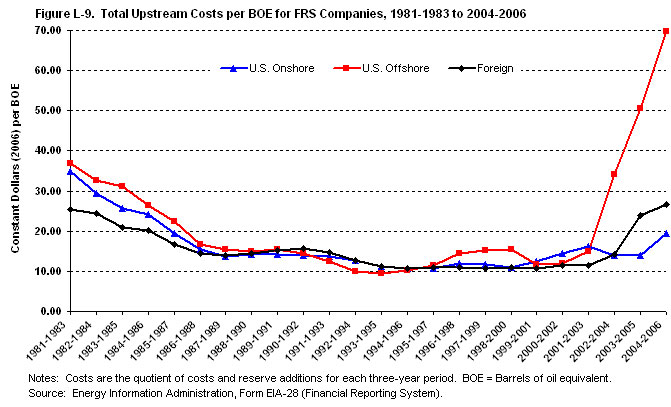
According to the Department of Energy, Energy Information Agency, “total production costs” per barrel range from just under $10 per barrel in the Middle East to nearly $70 for US offshore oil. Average world total production costs approach $30 per barrel.
Total Production Costs
DOE-EIA says,
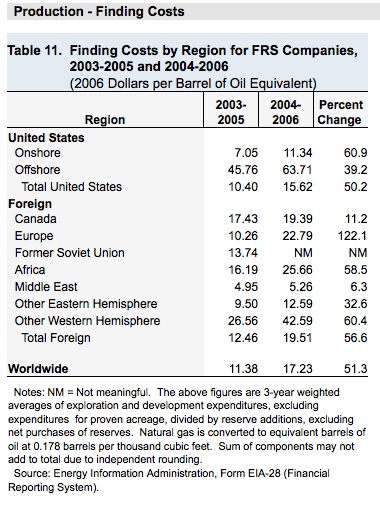
“In 2006, average production costs (or “lifting” costs, the cost to bring a barrel of oil to the surface) ranged from about $4 per barrel (excluding taxes) in Africa to about $8.30 per barrel in Canada; the average for the U.S. was $6.83/barrel (an increase of 23% over the $5.56/barrel cost in 2005). Besides the direct costs associated with removing the oil from the ground, substantial costs are incurred to explore for and develop oil fields (called “finding” costs), and these also vary substantially by region. Averaged over 2004, 2005 and 2006, finding costs ranged from about $5.26/barrel in the Middle East1 to $63.71/barrel for U.S. offshore. While technological advances in finding and producing oil have made it possible to bring oil to the surface from more and more remote reservoirs at ever increasing depths, such as in the deepwater Gulf of Mexico, the total finding and lifting costs have increased sharply in recent years.”
Finding Costs

Lowest Level (less than $30 per barrel): If Saudi Arabia wanted to do so, they could lower the asking price for their current oil production substantially from the current $100+ price, and still make huge per barrel profits while reducing incentives for others to find other oil or to develop alternative energy sources. However, that seems a bit far fetched to us.
Very Low Level ($30 to $70 per barrel): Generally, we would think, world total costs would be a very low price support level. It is doubtful that reserve owners would sell the commodity for less than their replacement costs of about $30.
Low to Moderate Level ($70 to $90 per barrel): Since offshore and deep water oil is a major focus globally for new reserves, the total production costs of offshore oil could be a price bottom for oil. Perhaps more importantly, oil averaged $72 per barrel in 2007, according to DOE-EIA, which wasn't all that long ago. The world is changing, but demand probably did not double in less than a year to support recent high oil prices of about $145.
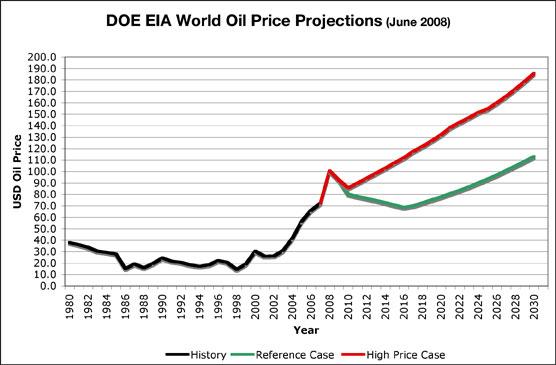
Projections: Looking forward the DOE-EIA projects $119 as an average crude price for 2008 and $124 in 2009. However as recently at June, DOE-EIA was predicting a $100 average price for 2008 and about $93 in 2009, as shown in the chart below.
They don't know either. The situation is in major flux and does not lend itself to trend projection. However, their earlier projection of a roughly $90 to $100 range for 2008-2009 might be used as another indicator of a support level for oil prices.
Canadian Oil Sands filed their Annual Information Form in March 2008 and reported an average per barrel revenue of $79 in 2007 and projected an average of $92 for 2008 and $82 for 2009 for financial reporting purposes.
Conflict Scenario: War and terror puts everything in a cocked hat, although is it also interesting to see that the Georgian/Russian conflict did not move oil prices up. That was merely a skirmish and prospectively changed control of certain oil assets, but did not curtail energy flow. Serious conflict in oil regions simply changes the game. Price projection: “a big number”.
Long-Term Scenario (UP): Increasing per capita standard of living for an increasing world population, and populations growing faster than proven oil reserves moves the price point up. There is fairly direct correlation between rising living standards and rising energy consumption. Until the world moves to alternatives, the long-term trend for oil is up.
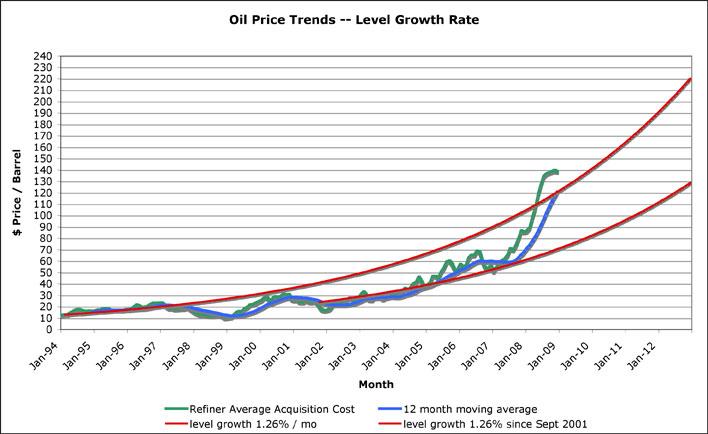
Our Own Projections: Looking simply at long-term trends, we would see something like $70 as a low price for oil in the short-term. The chart below plots the monthly and 12-month average average acquisition cost per barrel for refiners in the US from 1994. It also shows two smooth red lines. The upper line represents a level 1.26% monthly price increase from January 1994. The lower line represents a level 1.26% monthly price increase from September 2001, when arguably the market dynamics for oil changed due to the terror attack on the US.
Conclusion: We're not oil experts, but we like you must take a view of oil prices because they permeate so much of the investment world, not just the energy sector.
Oil might go to $70, and could even overshoot below that (below offshore total production costs), but probably not.
We would tend to think that with oil below $100, and better yet under $90, a good long-term buying opportunity probably exists for oil assets.
The final good news is that long-term oil price trends will probably bail you out if you enter before a near bottom in the short-term.
By Richard Shaw
http://www.qvmgroup.com
Richard Shaw leads the QVM team as President of QVM Group. Richard has extensive investment industry experience including serving on the board of directors of two large investment management companies, including Aberdeen Asset Management (listed London Stock Exchange) and as a charter investor and director of Lending Tree ( download short professional profile ). He provides portfolio design and management services to individual and corporate clients. He also edits the QVM investment blog. His writings are generally republished by SeekingAlpha and Reuters and are linked to sites such as Kiplinger and Yahoo Finance and other sites. He is a 1970 graduate of Dartmouth College.
Copyright 2006-2008 by QVM Group LLC All rights reserved.
Disclaimer: The above is a matter of opinion and is not intended as investment advice. Information and analysis above are derived from sources and utilizing methods believed reliable, but we cannot accept responsibility for any trading losses you may incur as a result of this analysis. Do your own due diligence.
Richard Shaw Archive |
© 2005-2022 http://www.MarketOracle.co.uk - The Market Oracle is a FREE Daily Financial Markets Analysis & Forecasting online publication.


