


Understanding Crude Oil Behavior
Commodities / Crude Oil Feb 14, 2018 - 10:59 AM GMTBy: Nadia_Simmons

 On Monday, oil bulls extended gains after Friday's invalidation of the breakout, which together with the buy signal generated by the Stochastic Oscillator suggest further improvement. A least at the first sight. But does watching the room through the keyhole give us a full picture of what's inside? We also think so, therefore, we invite you to analyze a broader picture of crude oil.
Let’s analyze the charts below (charts courtesy of http://stockcharts.com).
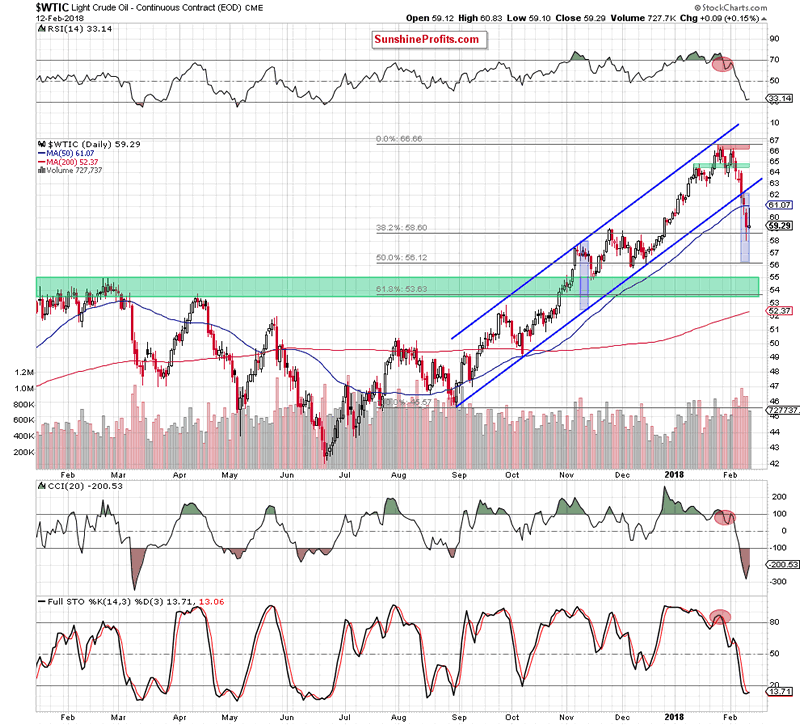
On the daily chart, we see that thanks to Friday’s decline the commodity dropped to our first downside target - the 38.2% Fibonacci retracement (based on the August-January upward move), but then rebounded and invalidated the earlier breakdown under this support. As you see, this positive event encouraged oil bulls to act, which resulted in further improvement after the market open.
But did the bulls’ “rally” change anything in the overall picture of black gold? Some of you will likely say that an invalidation of the breakdown under the above-mentioned retracement in combination with the buy signal generated by the Stochastic Oscillator could trigger further improvement.
Of course, such a probability can’t be ruled out, however, focusing only on these two positive factors without looking more closely at the bearish arguments is like watching a closed room through a keyhole. We see only a little piece of a larger image, which can be confusing. Why are we writing about it? Let’s analyze the factors, which oil bears have on their side.
Firstly, light crude increased to the previously-broken 50-day moving average, but then reversed and decline quite sharply, which looks like a verification of the earlier breakdown under this line. Secondly, size of volume, which accompanied yesterday’s increase was visibly smaller compared to what we saw in the previous week during declines. Thirdly, although the Stochastic Oscillator generated the buy signal, the sell signals generated by the RSI and the CCI remain in the cards.
On top of that, let’s recall the most important factor, which justifies the maintenance of short positions (seen on the medium-chart below).
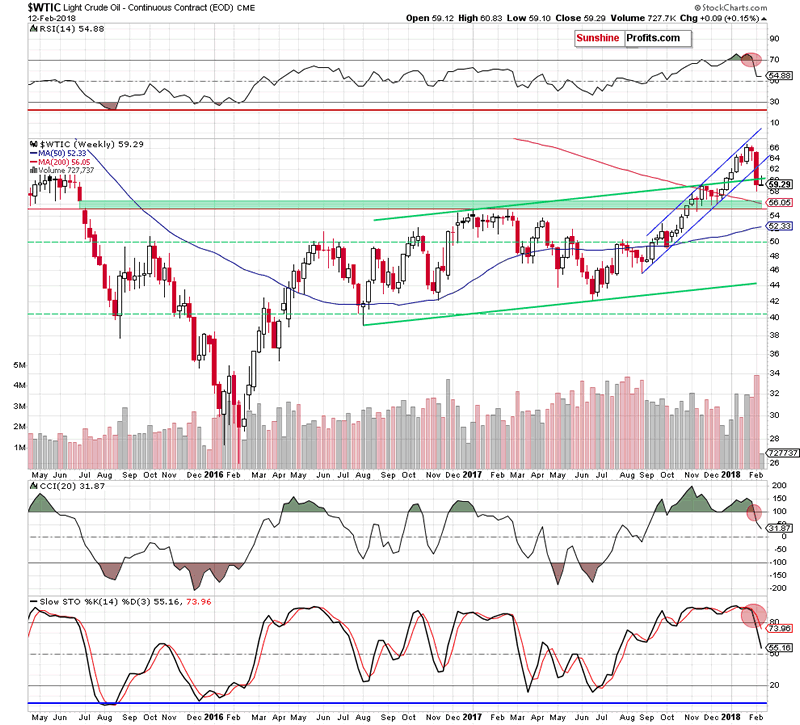
What do we mean? An invalidation of the breakout above the upper border of the green rising trend channel, which materialized on huge volume, increasing the probability of further deterioration.
Additionally, from this perspective, we clearly see that yesterday’s price action also looks like a verification of the breakdown under this important resistance line, which is (at least at the moment of writing these words) a bearish development – especially when we factor in the sell signals generated by all the medium-term indicators.
And speaking of the indicators…. let’s zoom out our picture and take a look at the long-term chart. Will oil bears find an ally here?
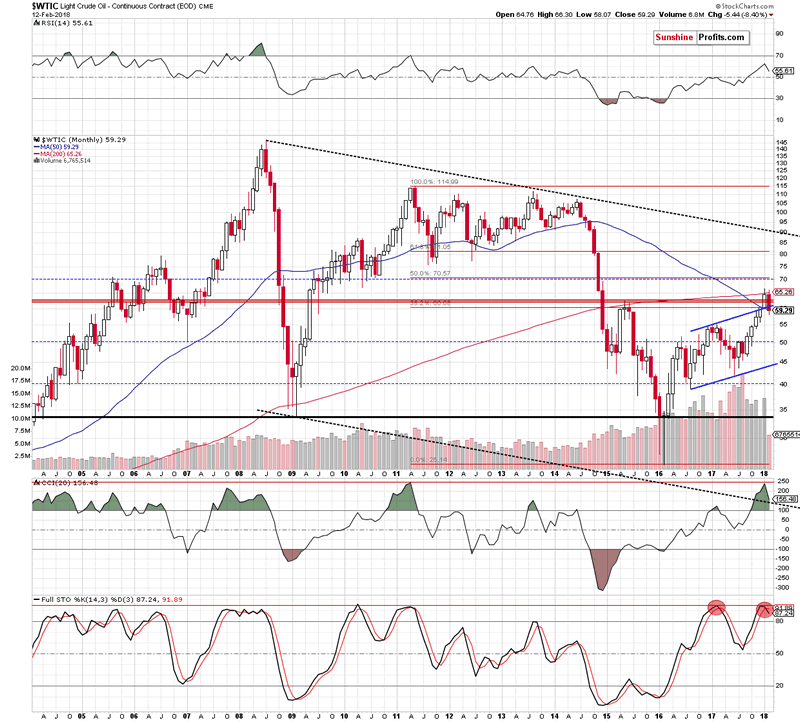
In our opinion, even four: another invalidation of the tiny breakout above the 200-month moving average, an invalidation of the breakout above the May 2015 peaks, an invalidation of the breakout above the 38.2% Fibonacci retracement and the sell signal generated by the Stochastic Oscillator.
The last time when this indicator generated the sell signal was in March 2017. What happened in the following moths? Declines, which took crude oil not only below the barrier of $50, but also to the 2017 low of $42.05.
Taking all the above facts into account, we believe that short positions continue to be justify from the risk reward perspective as another move to the downside is just around the corner.
Where could black gold head next? In our opinion, the first downside target will be around $55.82-$56.12, where the December lows and the 50% Fibonacci retracement are. Additionally, in this area the size of the downward move will correspond to the height of the blue rising trend channel, which increases the probability that oil bears will test this area, making our short positions even more profitable in the coming week.
If you enjoyed the above analysis and would like to receive free follow-ups, we encourage you to sign up for our daily newsletter – it’s free and if you don’t like it, you can unsubscribe with just 2 clicks. If you sign up today, you’ll also get 7 days of free access to our premium daily Oil Trading Alerts as well as Gold & Silver Trading Alerts. Sign up now.
Thank you.
Nadia Simmons
Forex & Oil Trading Strategist
Przemyslaw Radomski
Founder, Editor-in-chief
Sunshine Profits: Gold & Silver, Forex, Bitcoin, Crude Oil & Stocks
Stay updated: sign up for our free mailing list today
* * * * *
Disclaimer
All essays, research and information found above represent analyses and opinions of Nadia Simmons and Sunshine Profits' associates only. As such, it may prove wrong and be a subject to change without notice. Opinions and analyses were based on data available to authors of respective essays at the time of writing. Although the information provided above is based on careful research and sources that are believed to be accurate, Nadia Simmons and his associates do not guarantee the accuracy or thoroughness of the data or information reported. The opinions published above are neither an offer nor a recommendation to purchase or sell any securities. Nadia Simmons is not a Registered Securities Advisor. By reading Nadia Simmons’ reports you fully agree that he will not be held responsible or liable for any decisions you make regarding any information provided in these reports. Investing, trading and speculation in any financial markets may involve high risk of loss. Nadia Simmons, Sunshine Profits' employees and affiliates as well as members of their families may have a short or long position in any securities, including those mentioned in any of the reports or essays, and may make additional purchases and/or sales of those securities without notice.
© 2005-2022 http://www.MarketOracle.co.uk - The Market Oracle is a FREE Daily Financial Markets Analysis & Forecasting online publication.