


US Dollar at the Start of Multi-Year Downtrend
Currencies / US Dollar Mar 05, 2018 - 02:39 PM GMT

Since the US Dollar trades freely in the 1970s, on average it has rallied and declined in a period of 7.5 years. The chart below shows short term and long term US Dollar cycle:
Short Term and Long Term US Dollar Cycle
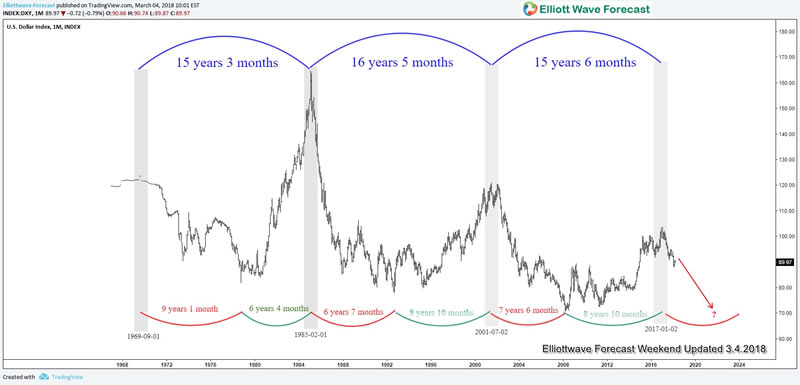
From the chart above, we can see that since 1970s, the cycle in US Dollar from peak to peak (blue color) is about 15 years on average. The 15 year peak-to-peak cycle is subdivided into 2 sub-cycles: USD weakness period (peak to trough) in red color, and USD strength period (trough to the peak), in green color. Each sub-cycle lasts roughly 7.5 years on average.
US Dollar currently appears to have ended the last peak on January 2017. The previous cycle in USD strength (green color) lasted from September 1992 – July 2001 for a period of 8 years 10 months. The latest cycle in USD strength (green color) lasted from March 2008 to January 2017, which is the same 8 years 10 months up-cycle compared to the previous one. The peak-to-peak cycle has also reached the average of 15 years.
If this cycle is going to repeat, then US Dollar appears to continue to get weak in red cycle (downtrend) from year 2017 to 2024 – 2025 before it starts a 7 year up cycle (green color) from year 2024 to 2031. What leads to the trend change in USD is a combination of valuation, current account dynamic, and the Central Bank Action like the chart below from Nomura shows:
Overvaluation
Based on the Purchasing Power Parity, US Dollar on average is 20% overvalued against other major currencies, including Yen, Euro, Pound, and Canadian Dollar. Valuation extremes usually suggest the US Dollar has gone too much and we have started to see the reversal lately and likely will continue to see it in the next few years.
Growing Account Deficit
The US current account deficit now is running at 3%. Current account is the total export value of the goods and services minus the total imports. In the last 30 years, when the US account deficit reaches extreme levels between 2.5 – 3%, the Dollar is close to reversal. The last time US Dollar reached multi-year peak at 1985 and 2001, the US also had a current account deficit of 2.5 – 3%.
Central Bank’s Action
In the past, we saw a divergence in the monetary policy and interest rate between the Fed and other central banks, causing US Dollar’s strength. For example, the Fed started tapering in 2013 and hiked the interest rate in 2015, whereas other central banks were still loosening policy. This divergence caused US Dollar to soar and appreciate against other major currencies.
However, global recovery caused other central banks to also unwind the loose monetary policy. The Bank of Canada has started to hike rate. ECB and BOJ have started to taper bond’s buying. This removes one major support for USD and makes the dollar vulnerable even if the Fed continues to hike further.
If you enjoy this article, check our work and join Free 14 days Trial to see Elliott Wave Forecast for 78 instrument, as well as getting access to Live Trading Room, Live Session, and more.
By Ayoub Ben Rejeb
https://elliottwave-forecast.com
ElliottWave-Forecast has built its reputation on accurate technical analysis and a winning attitude. By successfully incorporating the Elliott Wave Theory with Market Correlation, Cycles, Proprietary Pivot System, we provide precise forecasts with up-to-date analysis for 78 instruments including Forex, Commodities, Indices and a number of Stocks & ETFs from around the World. Our clients also have immediate access to our proprietary Actionable Trade Setups, Market Overview, 1 Hour, 4 Hour, Daily & Weekly Wave Counts. Live Screen Sharing Sessions, Daily Technical Videos, Elliott Wave Setup and Weekend videos .
Copyright © 2018 ElliottWave-Forecast - All Rights Reserved Disclaimer: The above is a matter of opinion provided for general information purposes only and is not intended as investment advice. Information and analysis above are derived from sources and utilising methods believed to be reliable, but we cannot accept responsibility for any losses you may incur as a result of this analysis. Individuals should consult with their personal financial advisors.
© 2005-2022 http://www.MarketOracle.co.uk - The Market Oracle is a FREE Daily Financial Markets Analysis & Forecasting online publication.