


The Stock Market Trend is Your Friend ’til the Very End
Stock-Markets / Stock Markets 2018 Mar 15, 2018 - 12:13 PM GMT

 If you’ve been following me for any length of time you know I’ve been a major bull when it comes to the stock markets. The last two years were some of the best years to be a bull in one of the greatest bull markets of all time and I don’t say that lightly.
A little over a month ago we got our first correction of 12% in over two years on the SPX. Everyday the SPX would be up four or five points on the open, nothing major, and then move slowly higher in a non threatening way which made it fairly easy to stay on trend. Impulse moves like that are the easiest part to trade as the corrections, when they came, were very small of only 3% to 5%.
That all changed a little over a month ago when it was time for the stock markets to correct that two year impulse leg up. When it’s time to correct the markets don’t need an excuse they just do it and it usually comes out of nowhere. The initial leg down is usually the hardest followed by counter trend moves that eventually build out some type of pattern.
Tonight I would like to show you some of the long term charts which is the best proxy to define if the stock markets are in a bull or bear market. One of the most important decisions an investor can make is to determine if the market they choose to play is in a bull or bear market. Trading long in a bull market can be forgiving if your entry point is off. Eventually the price action will catch up to the bull and you’ll be forgiven for your bad entry point. On the other hand, if you go long in a bear market you’ll be constantly fighting the dominate downtrend like a salmon swimming upstream. It’s always much easier to go with the dominate trend, long during bull markets and short during bear markets. It sounds simple but I can assure you it is not.
For instance the bull market that started in the PM complex back in 2000 was a good example of trading inline with the uptrend. One could have done some shorting, but it would have been a much tougher game to play. After the bull market topped out in 2011 those folks that traded to go long the PM complex have been fighting a tough battle. There can be some small victories, but the big prize comes when you can get in sync with the major trend whether it’s up or down. As many are finding out major trends can last for many years and is unforgiving when you try to trade against it.
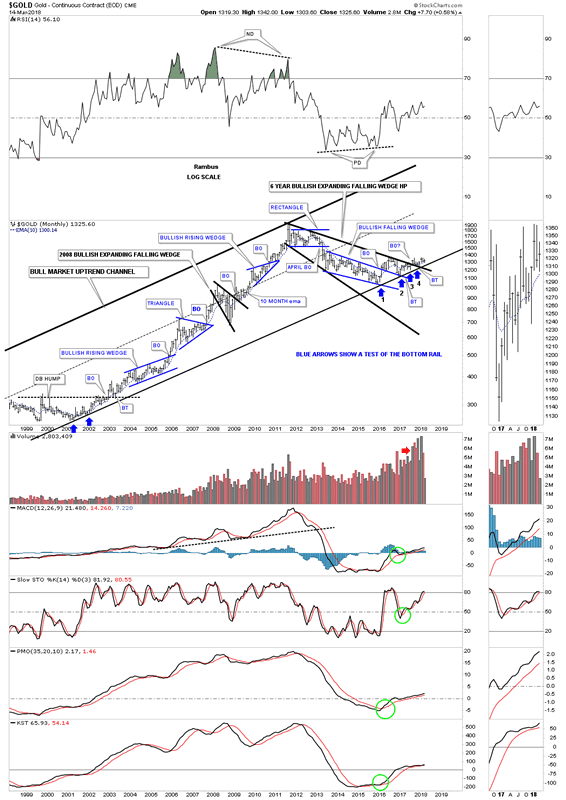
Below is a 20 year monthly chart for gold which shows you the beautiful bull market uptrend channel along with all the consolidation patterns. You can throw a dart anywhere within that uptrend channel for a place to buy. As you can see you will eventually be vindicated with your buy point. It might not be the best entry point, but you’ll eventually turn a profit.
Now throw a dart at the correction that began in 2011 to the present day which I’ve labeled as a six year expanding falling wedge. It should become very obvious to you how much harder it is to go long during a bear market vs a bull market. Even if you were good enough to pick the exact low and sell at the exact high you would have made a decent profit but nothing like an impulse move up during the bull market years.
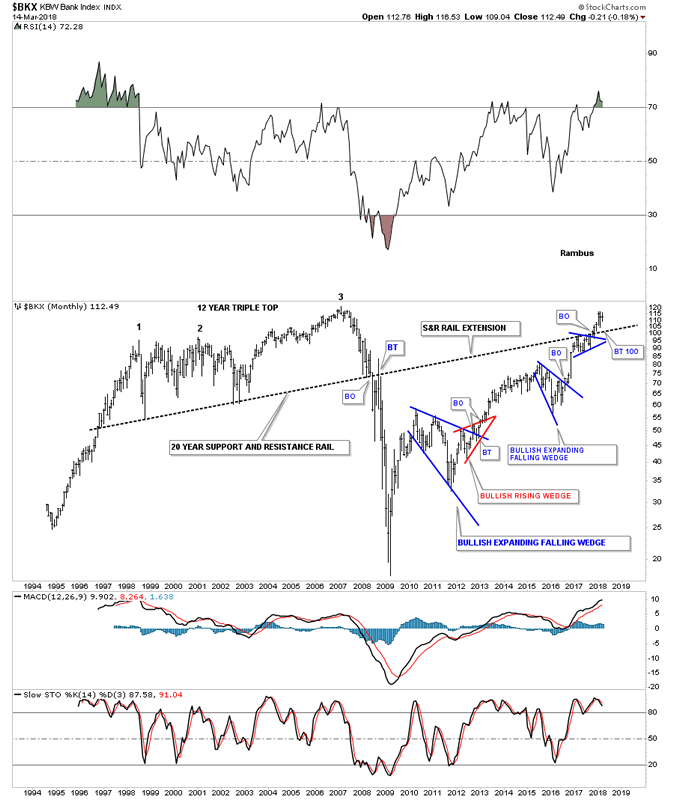
Next I would like to show you some stocks that are in a long term bull market. Many of these charts I’v been posting for many years as there bull market has been unfolding before our very eyes. This first chart is the $BKX, banking index, which gave me a major heads up back in 2007 that something wasn’t right with this index. Fundamentals couldn’t have told you when the game was over, but the break below that massive S&R line did. Several years ago I extended that S&R line to the right hand side of the chart wondering if it was still hot. As the old saying goes, an important trendline never dies it just slowly fades away. Note how the price action built out that blue triangle just below the S&R line which told us it was still hot. We could see a backtest from the topside which wouldn’t affect the bullish potential for this index, above is bullish and below is bearish.
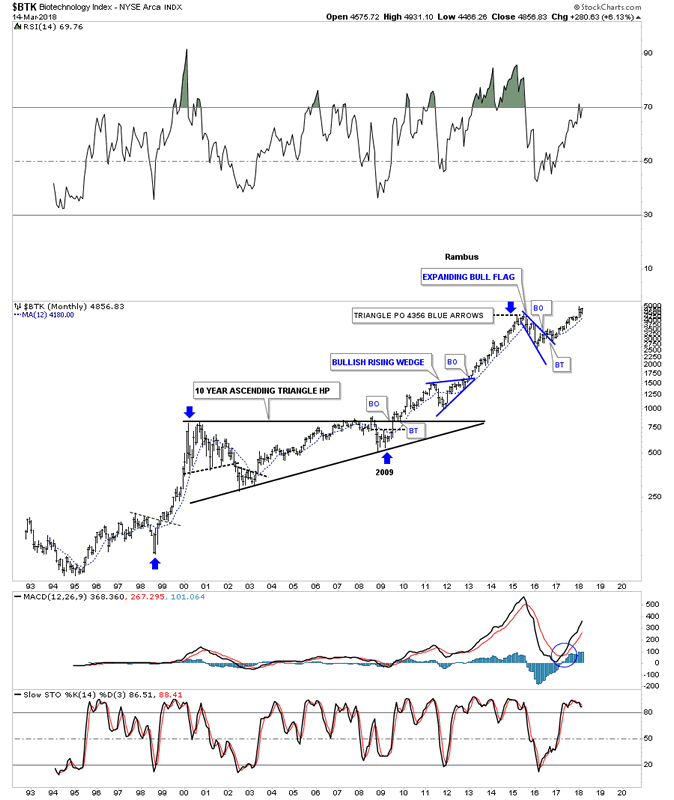
Below is the $BTK, biotechnology index, which has been tough to trade in the short term, but when one looks at this long term chart the price action is just off of its all time highs and looks like it wants to go higher. Again, throw a dart at the price action since the 2009 low to the present and you will have a profitable trade. On the other hand try shorting the 2009 bull market and see if you could have made any real money.
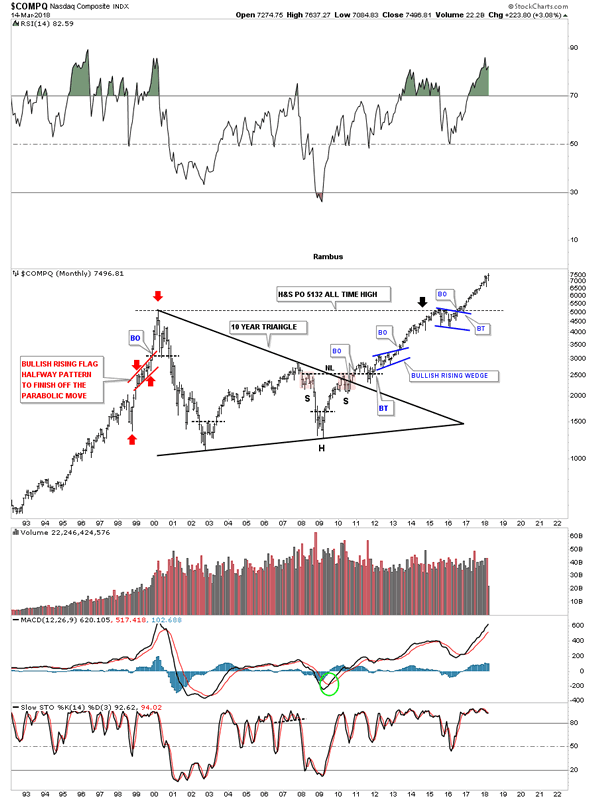
Next is a monthly chart for the $COMPQ. How much would you have gained if you had kept shorting this bull market that began in 2009. It can be done but the big profits go with the bull.
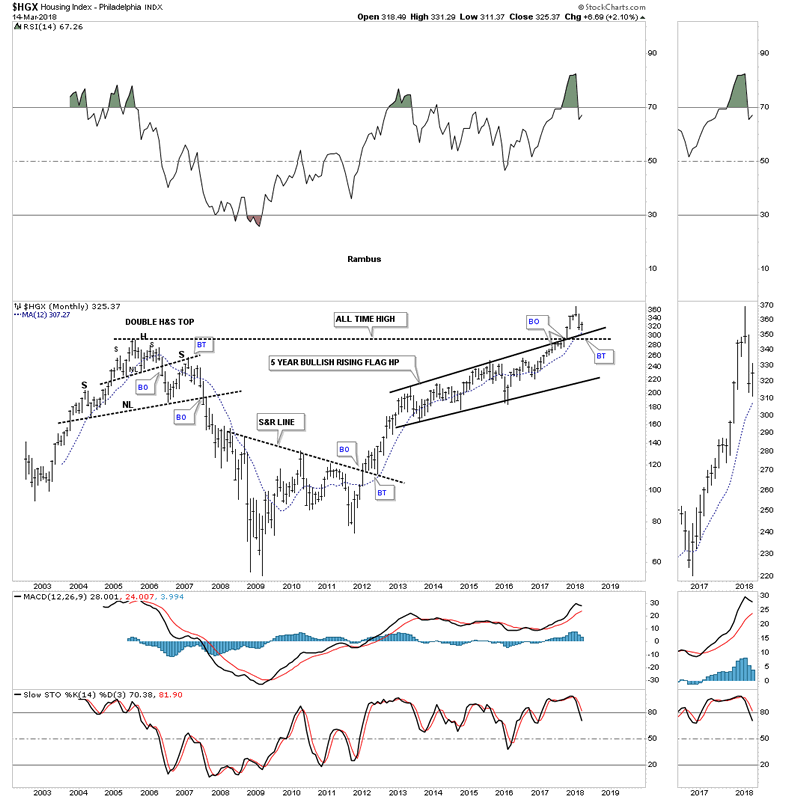
Is the $HGX, housing index, completing a breakout and backtest to the top rail of a five year bullish rising flag?
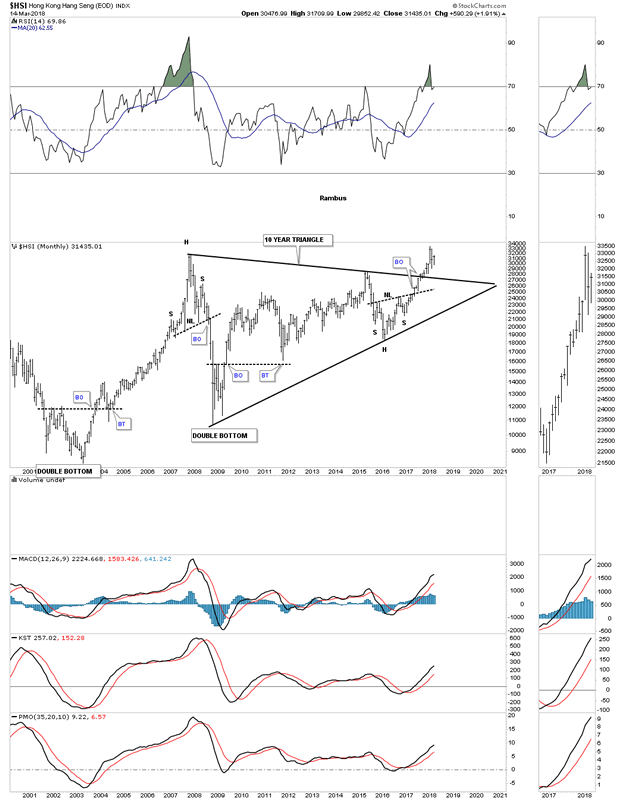
The $HSI, Hong Kong stock market, is breaking out from a 10 year triangle consolidation pattern.
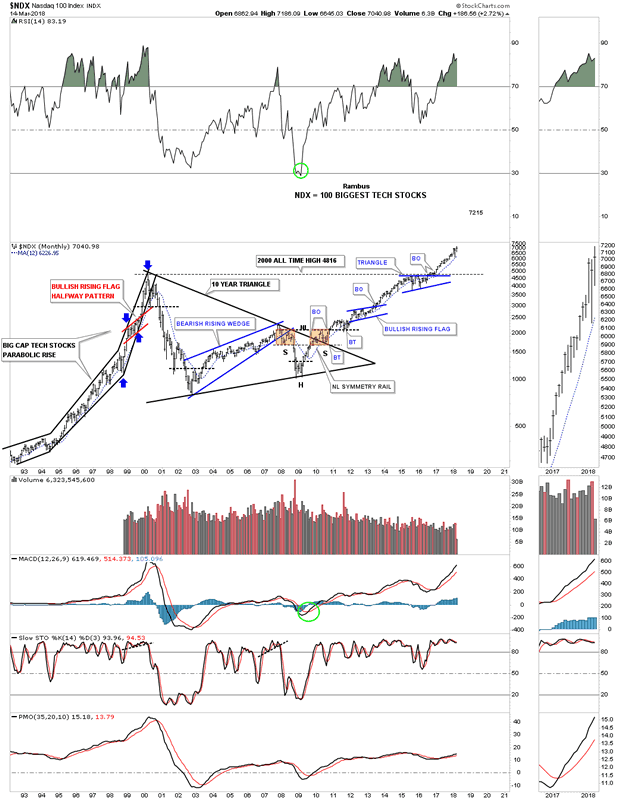
Of all the US stock markets the $NDX 100 has some of nicest Chartology.
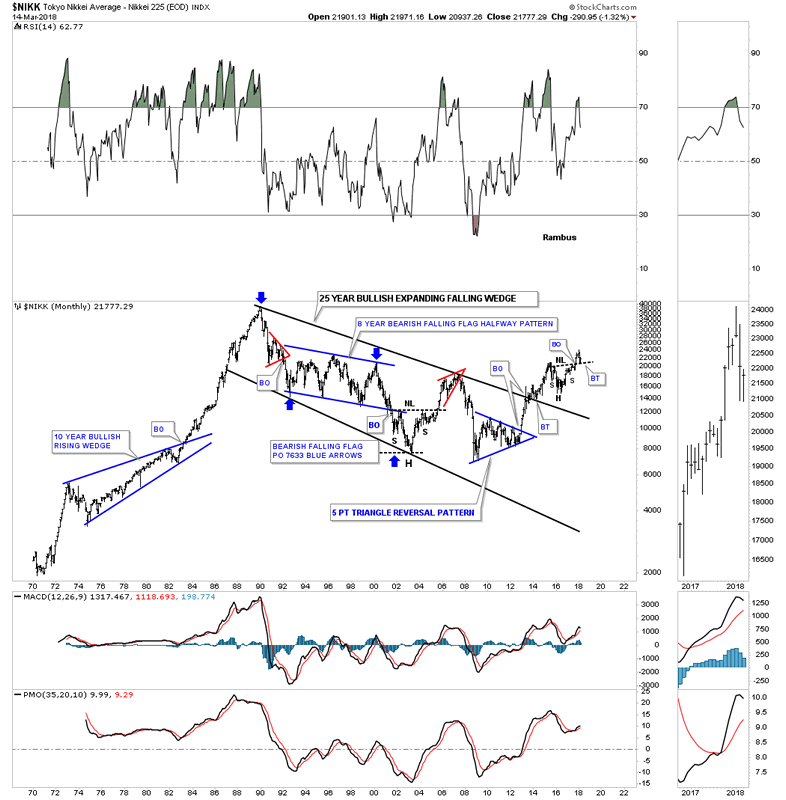
After breaking out from a 25 year bullish expanding falling wedge the $NIKK Japanese stock market, built out a H&S consolidation pattern. It’s currently in the process of backtesting the neckline.
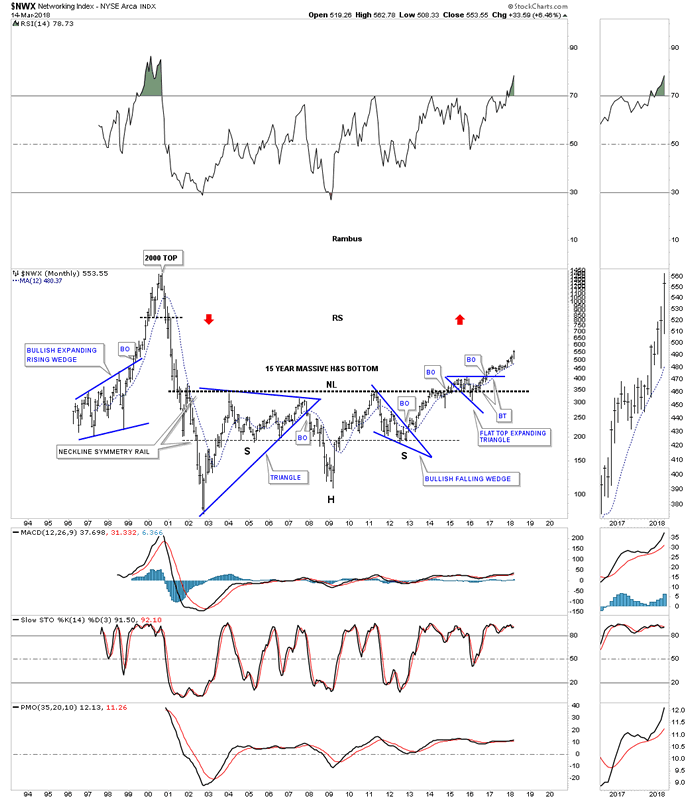
After several years of breaking out and backtesting that massive neckline the $NWX, networking index, is finally beginning to move higher. The red arrows shows how this index may reverse symmetry to the upside vs how it came down.
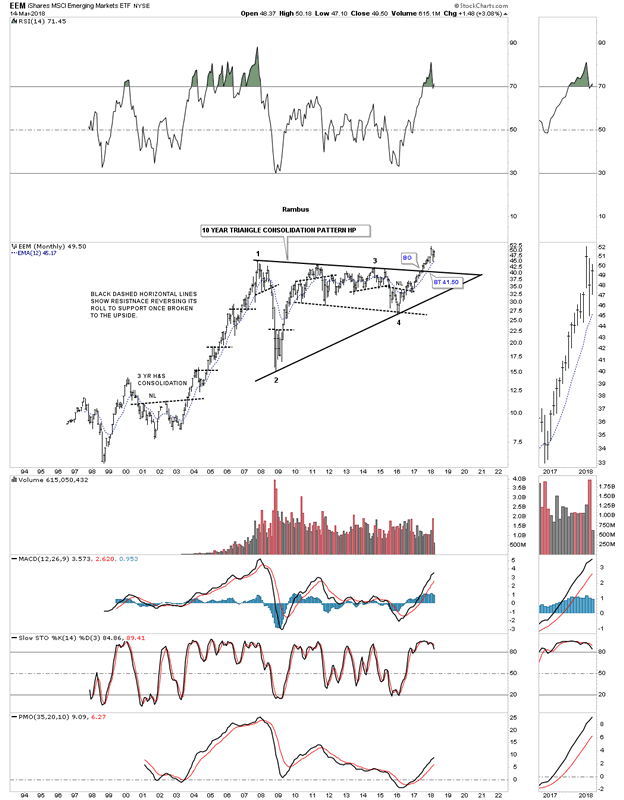
We caught the biggest part of the last impulse move higher on EEM emerging markets etf, but when I sold out a month ago I’m looking for a place to get back in. Sometimes the markets don’t make it easy for you once you lose your position.
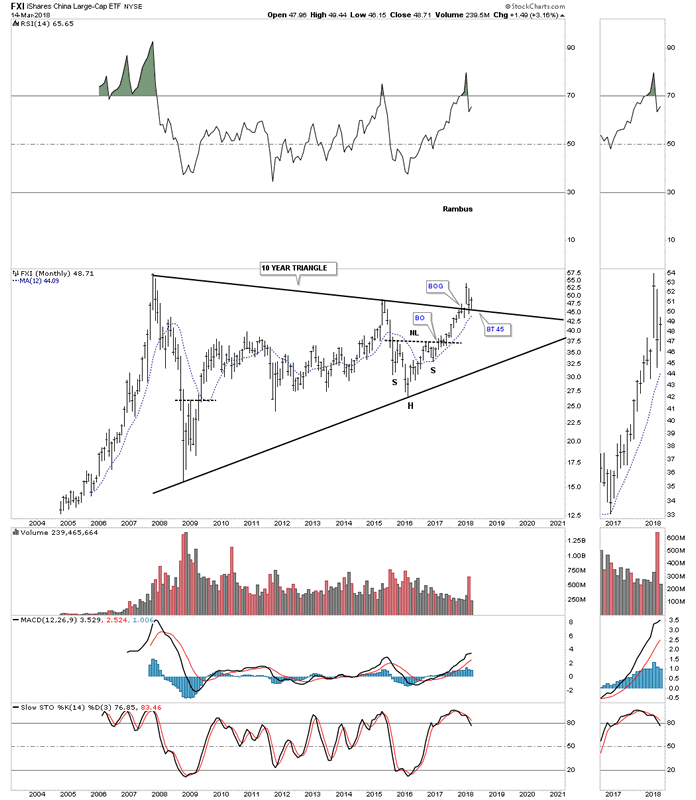
Below is another index the FXI China large cap etf, that I’m looking for a new entry point as it is just breaking out and backtesting the top rail of a 10 year triangle consolidation pattern.
I have many more stock I could show you that are strongly suggesting the bull market that began in 2009 is still very strong. What is so special about our current bull market is that it’s a world wide event that is taking most countries to a new standard of living especially the 3rd world countries. It’s a good thing to see struggling countries get a piece of the pie that we take for granted. We live in a global community now where everyone is tied together in one way or another. This boom will have its pit falls along the way, but I for one am glad to see the world participating in a new paradigm shift for the many.
All the best
Gary (for Rambus Chartology)
FREE TRIAL - http://rambus1.com/?page_id=10
© 2018 Copyright Rambus- All Rights Reserved
Disclaimer: The above is a matter of opinion provided for general information purposes only and is not intended as investment advice. Information and analysis above are derived from sources and utilising methods believed to be reliable, but we cannot accept responsibility for any losses you may incur as a result of this analysis. Individuals should consult with their personal financial advisors.
© 2005-2022 http://www.MarketOracle.co.uk - The Market Oracle is a FREE Daily Financial Markets Analysis & Forecasting online publication.