How I Learned Cryptos and Became the Ethereum Whisperer
Currencies / BlockChain Apr 06, 2018 - 08:57 AM GMTBy: Avi_Gilburt
 Ryan Wilday : While we still await the crypto bottom, I want to start this week's article off with a personal narrative. I owe my current working life to ethereum.
In 2016, I was a practicing design strategist for Samsung while trading as a hobby. In fact, I had already been trading for two decades when I decided to continue my study of the market by learning Elliott Wave Theory as a member of elliottwavetrader.net. Soon after that, I started using my new knowledge with ethereum (ETHUSD), then a new coin.
It was by applying Elliott Wave Theory to ethereum that I gained the nickname the Ethereum Whisperer on the site. The theory, even while I was still learning it, proved helpful in spotting key turning points in ethereum.
I exited ethereum trading in May 2016, right after the Dao catastrophe. I didn't exit because of the hack, but because Elliott Wave Theory suggested we had started a large decline with a break of $17.
I stayed out of the trade until December 2016 when Elliott Wave gave me its first buy signals. The price of entry then was roughly $7.
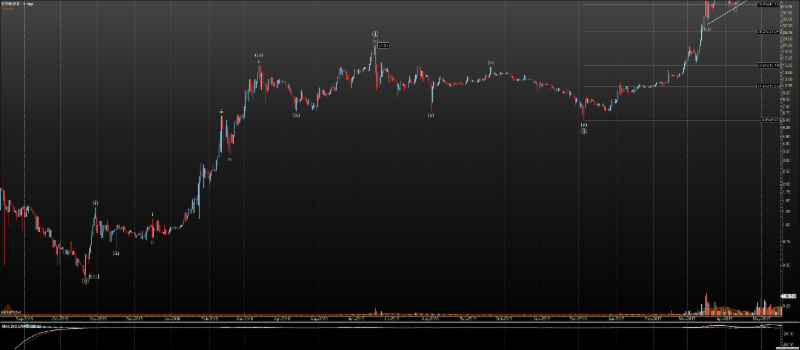
Fast forward three months to March 2017, and I was expecting to see a top pattern in ether with a target of $39 for its third wave. However, no top pattern as defined by Elliott Wave was showing.
What was happening? I continued to trade it upward waiting for the price structure to clue me in.
Soon, a fellow member wrote a large post regarding the need to use logarithmic Fibonacci levels in the use of Elliott wave. At the time, I was using linear. Wondering if that was why the top pattern had not shown, I devoured his post and found the necessary calculations to add to my Tradingview charts.
When I looked at the results of the calculations, I nearly fell out of my chair. You see, the target for the impulsive third wave in ethereum that was $39 in linear was $3587 in log.
The reason for this is simple. In log Fibonacci, projections are based on the % return of waves one and two. This is shown on my chart with a range of 41 cents to $21.39 (depending on exchange). If you are using linear, however, the projection is based on the absolute price change. While I won't go into the equations, I'm sure the mathematicians reading this will know what I'm saying.

View page where you can enlarge the charts.
Now, when I say ethereum changed my life, I'm not exaggerating. I left my corporate job, and at present now I am responsible for running the cryptocurrency service at Elliott Wave Trader. I track not only ethereum, but also over 100 other cryptos, making trade suggestions and posting a model portfolio for members.
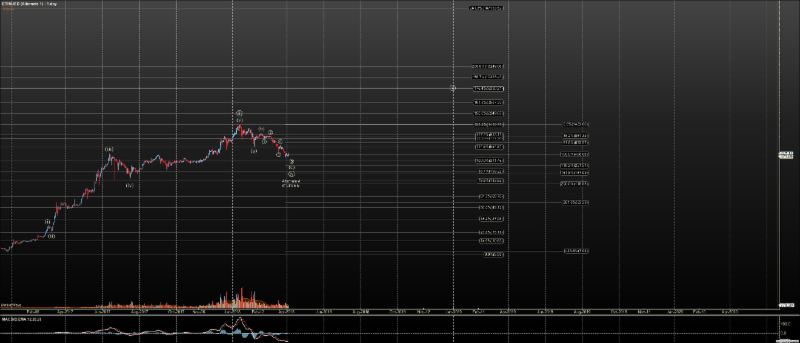
And, ethereum itself has continued as I've expected but has adjusted slightly. We now are in a large-scale correction that we believe will soon be complete.
We had a perfect hit of the 1.382 extension at approximately $1420 to usher in this correction. This is a key level for either the minor third of our primary third wave, or it can be a low primary third.
Members on our site know that I had mentioned this as a risk area in the run up. Because we hit that level and then broke support for IV of three, it is now my belief that we've seen an early top lower than our expected $3587, unless we in turn see catchup extensions later in the market.
Yet, despite this low third, we have the primary wave five to look forward to, and its start may be just around the corner. With the low hit for primary third, we can expect a low hit for the fifth wave at the 1.764. This level is $6330 over 15X multiple from today's level. While I don't know how fast it will get there, previous minor waves lasted 6 months. This being primary, it may take 9 to 12 months.

View page where you can enlarge the charts.
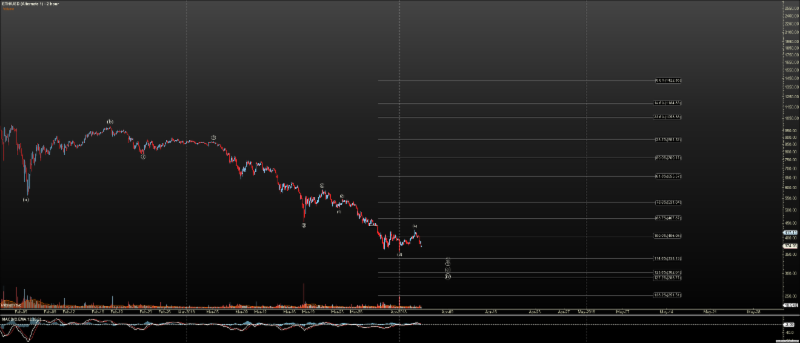
The question still remains whether the correction is done. Support for this count is $208. However, the ideal level it holds is $328.
Our lowest level so far was only $360, which is very close. Furthermore, the overall structure of the decline suggests completion is nearing. We can often see extensions in the C wave of a correction, but it has a nearly complete set of sub-waves (five as shown), and that C wave has the expected relationship in length to the preceding A wave.

View page where you can enlarge the charts.
Now, to prove that we have a bottom in place, we are looking for an impulse. Today, we only have the early signs of a bottom and need to see if it will follow through. Three levels jump out, and each subsequent break raises the probability of a bottom:
--$590 the top of the current fourth of C,
--$840 the .618 retrace of the entire correction,
--and finally, $890, 2 of C.
With each level taken out, we can raise the probability that the bottom is in. Also, we are looking for an impulsive structure in five waves with the third properly extended. If the structure remains corrective in nature, we ought to be skeptical.
Conclusion
In conclusion, Elliott Wave offers objective levels both in the forward price projections price can reach, and where support lies for a trend to continue. However, price often takes a turn that is unexpected.
Nevertheless, Elliott Wave helps us adjust. I personally have a history of trading ethereum successfully using the theory, and currently see this area, between $328 to $360 as a possible bottom for a larger primary wave five to $6920.
However, $208, the key support, needs to hold for that to remain my expectation.
There is also a chance, slim now, that old projections will reassert themselves in the market with an extension. This would replace the current with the older primary third target at $3563. The primary five target in that situation would be a very large $16,593.
See charts illustrating our wave counts on ETHUSD.
Ryan Wilday is a cryptocurrency analyst at ElliottWaveTrader, where he hosts the Cryptocurrency Trading premium subscription service.
© 2018 Copyright Ryan Wilday - All Rights Reserved Disclaimer: The above is a matter of opinion provided for general information purposes only and is not intended as investment advice. Information and analysis above are derived from sources and utilising methods believed to be reliable, but we cannot accept responsibility for any losses you may incur as a result of this analysis. Individuals should consult with their personal financial advisors
© 2005-2022 http://www.MarketOracle.co.uk - The Market Oracle is a FREE Daily Financial Markets Analysis & Forecasting online publication.


