


A Handy Guide to Congressional Budget Office CBO Report
Interest-Rates / US Debt Apr 09, 2018 - 09:17 AM GMTBy: F_F_Wiley

 Tomorrow we’ll get the Congressional Budget Office’s first look at the budgetary consequences of Donald Trump.
That is, the CBO will release its 10-year budget outlook, which was delayed by a few months to allow enough time to assess recent legislation.
Expect the media to respond in a variety of ways, including matter-of-fact reporting and editorials slamming Trump and the GOP for fiscal profligacy. But whatever the perspective, most responses will have one thing in common—they’ll accept the CBO’s figures as being accurate and authoritative.
To which we call bull****—past CBO projections have been hugely overoptimistic, and there’s little reason to expect improvement in the future.
Projections or Deceptions?
The problem is twofold. First, the CBO’s governing statutes all but require a dishonest look at America’s finances. For example, the statutes don’t allow the CBO to account for tax breaks that Congress routinely extends on a year-to-year basis. Congress knows they’ll renew the tax breaks, we know that they know, they know that we know that they know, and so on, but the CBO is required to strap on a blindfold and build its “baseline” projection on only existing law.
But that’s just one example. Another is the inevitability of supplemental appropriations, which the CBO is required to ignore even as they averaged 0.4% of GDP between 1981 and 2010 (the period covered by the last three decennial tallies). That might seem like a small amount, but over a number of years it has a meaningful effect on debt-to-GDP ratios.
Or we could look at the equally inevitable bailouts and stimulus packages that Congress will surely agree in response to future economic setbacks. Bailouts and stimulus lifted deficits historically by about the same amount (on average) as supplemental appropriations, but they’re similarly disallowed from the baseline.
Putting together the various constraints on what the CBO is and isn’t allowed to show, it’s no exaggeration to call its baseline an Enron-like fraud. If a corporation were to produce the same analysis, it would fall well short of private-sector practices. And just to be clear, the problem isn’t the CBO’s doing—it’s how Congress wants projections reported and for what some might call nefarious reasons.
What Volatility?
The second part of the problem is that the baseline doesn’t include economic fluctuations on the same scale that we actually experience them. In fact, it didn’t include fluctuations at all until 2013, when the CBO’s economists added a tiny adjustment to account for recessions. But in our view, the adjustment isn’t nearly as large as it should be, and we’ll use a single chart to show why.
Here are forty years of annual unemployment rates alongside the CBO’s most recent unemployment outlook:
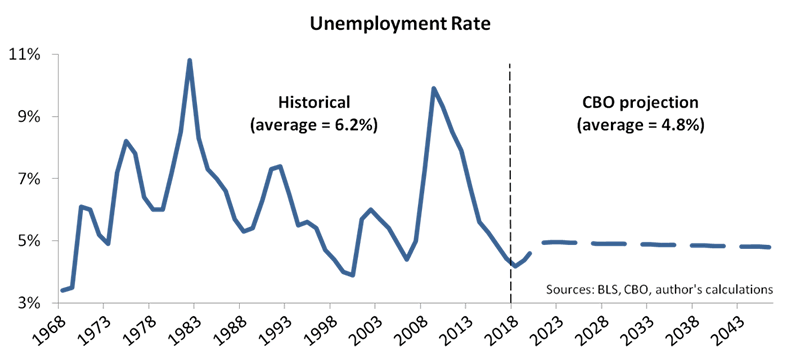
The unemployment rate, of course, can alter fiscal balances and government debt in a big way. Even a small discrepancy between actual unemployment and the CBO’s assumptions can blow up the baseline, as we’ve observed in the past.
But how big a discrepancy might we see in the future?
We would say “very,” and based on the chart above, we don’t think our view requires further explanation.
Can the Kool-Aid Be Remixed?
So here’s our suggestion.
Don’t drink the Kool-Aid, but don’t pour it down the drain, either.
When the CBO’s report comes out, have a look at the debt-to-GDP projections, mumble “yeah, like that’s realistic,” and then add the following adjustments:
- 2023 (projection year 5): Add 11% of GDP
- 2028 (projection year 10): Add 27% of GDP
Those were the average discrepancies between the true path for federal government debt and the CBO’s past projections for that path. In other words, they tell us how much tomorrow’s report will understate debt if it matches the average errors from past projections. (The CBO started making 10-year projections on an annual basis in 1993.)
Or, a more optimistic approach is to dig into the CBO’s spreadsheets (available on its website) and undo only the constraints and biases noted above. That requires more discussion than we’ve planned for this post, but if you’re willing to take our word for it, it suggests an adjustment of just over half of the figures above. (If you’re interested, this article discusses a similar approach.) Here are the “optimistic” adjustments we applied to the CBO’s projections from February 2017:
- Projection year 5: Add 8% of GDP
- Projection year 10: Add 14% of GDP
If you add either pair of adjustments to tomorrow’s projections, you should have a better idea of the likely debt trajectory.
Conclusions
Unless you’re convinced that debt doesn’t matter (we can just follow the wildly successful countries that money-printed or inflated their debts away, right?), we don’t expect tomorrow’s report to send you into your happy dance.
In fact, it’ll be worse than any 10-year projection the CBO has ever produced. (Congress made sure of that with recent tax and spending changes.)
But as bad as it’ll look, the reality is even worse. The budgetary consequences of Donald Trump (and his Congress), tacked onto the consequences of Barack Obama and George W. Bush (and their Congresses), point to a giant fiscal crisis ahead.
The crisis isn’t imminent, because it’ll take a long time for America’s creditworthy reputation to wear off. But with each third-millenial president, a crisis has become more and more certain. That’s the story the CBO’s media interpreters should tell tomorrow, but few of them will deliver such a message, let alone point out the deficiencies in the CBO’s mandated methods.
(Thank you for reading. For further discussion of fiscal risks and how they might play out, please consider reading our book, Economics for Independent Thinkers.)
F.F. Wiley
F.F. Wiley is a professional name for an experienced asset manager whose work has been included in the CFA program and featured in academic journals and other industry publications. He has advised and managed money for large institutions, sovereigns, wealthy individuals and financial advisors.
© 2018 Copyright F.F. Wiley - All Rights Reserved
Disclaimer: The above is a matter of opinion provided for general information purposes only and is not intended as investment advice. Information and analysis above are derived from sources and utilising methods believed to be reliable, but we cannot accept responsibility for any losses you may incur as a result of this analysis. Individuals should consult with their personal financial advisors.
© 2005-2022 http://www.MarketOracle.co.uk - The Market Oracle is a FREE Daily Financial Markets Analysis & Forecasting online publication.