The Oil Trade May Be Coming Alive
Commodities / Crude Oil Apr 14, 2018 - 04:58 PM GMTBy: WMA
 In all asset classes, following a major bear market, prices tend to stumble along at depressed levels – sometimes for years. Negative sentiment permeates across all types of investors, from the short-term traders to long-term retail investors. Once everyone is convinced that the paradigm has changed for the asset and prices at depressed levels are the “new normal”, the seeds will have been sown for the next bull market.
This is exactly what we saw with bank stocks, which remained depressed from 2009 through 2016. In 2009, the narrative was that banks would become regulated like utility companies. As the broad equity markets began soaring after 2011, banks still lagged. The new narrative was that banks can’t make money in a zero interest rate environment. Even as the Federal Reserve finally began increasing rates in December 2015, investors were unable to abandon the low rate, poor bank performance narrative. All investors had written off banks. Enter Donald Trump with his promises of deregulation and economic stimulus measures (an impetus for higher interest rates) and we finally saw bank sentiment swing from negative to optimistic. Since November 2016, the S&P Bank Index has out-performed the Russell 3000 by +18% through this week.
We believe oil prices are following this same process of suffering several years of depressed prices, as a pessimistic narrative permeates markets. From renewed talk of peak oil in the late 2000s, the narrative changed as oil prices began falling. From fears of falling oil supplies, markets began fearing oversupply of oil as OPEC decided against cutting production at a 2014 meeting in Vienna. Once a market changes direction, news follows the tape. The strengthening dollar became an impetus for further weakness in oil prices (even if the historic correlation coefficient between oil and the dollar is -0.20, suggestion only a weak negative correlation). Talk of alternative energy sources, which would reduce demand for fossil fuels, even became popular. Slowing growth in emerging markets, most importantly in China, added to demand side concerns.
As the negative narrative gained acceptance, the collapse in oil prices led to a major short-term drop in investment in the oil industry, with global investment in production and exploration falling from $700 billion in 2014 to $550 billion in 2015, with spill-over to energy commodities. On top of this, coming out of the Financial Crisis, the dynamics between oil-producing nations and oil-consuming nations were disrupted. Normally a supply-driven oil price decline raises world demand by transferring resources from high-saving oil producers to consumers with a higher propensity to spend. This channel, however, was muted, as major oil producers faced pressures to increase spending, and consumer countries continued to repair balance sheets from the financial crisis. In sum, this “perfect storm” took West Texas intermediate (WTI) crude oil from the $110/barrel handle in 2013 to a low of $26/barrel in 2016.
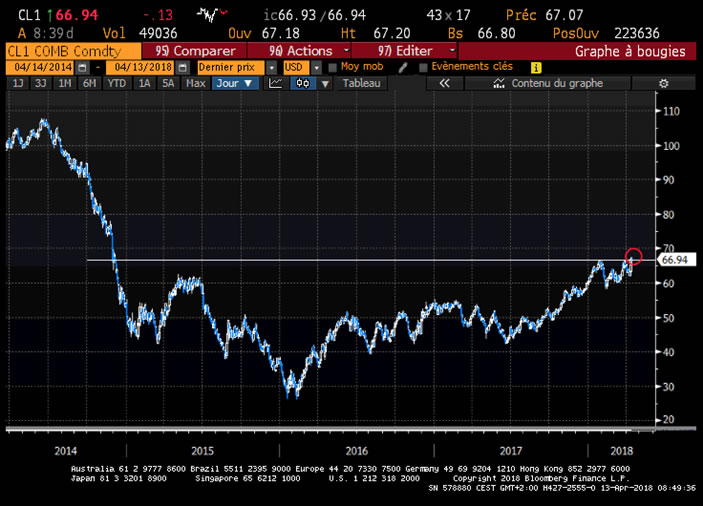
Fast-forward to 2018. The narrative surrounding commodities is becoming marginally less negative, although far from optimistic. This week was important step for WTI oil prices. As seen in the chart below, oil prices broke to new 41-month highs, closing the week at $67.39/barrel.

We have already discussed at length why energy and material stocks are a late economic cycle play. The end of an economic cycle is usually characterized by high inflation (which is met by central bank interest rate hikes). In a high inflation environment, investors turn to assets whose prices adjust automatically to rising prices, but at the same time will not take the full brunt of rising interest rates. Oil, natural gas and metals prices fit the bill.
The current economic cycle has also been characterized by an extraordinary run-up in the Dollar Index (DXY). From 2011 to 2017 the DXY rose +41%, which is an impressive counter-trend rally in an asset doomed to fall over the long-term. The reason why the dollar is a long-term, permanent down-trend is due to the reserve currency status of the dollar. The U.S. must constantly run a balance of payment deficit to keep the world awash in dollars (there are more dollars circulating outside the U.S. than within the fifty states). The 45-year chart of the DXY below confirms the long-term dollar down-trend since Bretton Woods. A falling dollar puts upward pressure on commodities, whose prices are quoted in dollars, and adjust to maintain a constant real value. While a near-term rally in the dollar after the recent -13% decline would be a temporary headwind for commodity prices, we remain intermediate/long-term bearish on the dollar.
Another factor that could support oil prices specifically in the coming months is the timing of the Aramco IPO. Talk is that deal might be delayed to 2019, but the Saudi oil minister (also OPEC head) says he's waiting for $80 Brent. With U.S. production now growing faster and the OPEC-Russia agreement to curtail production under pressure, we think the Saudi's want to do it as soon as possible and would not mind if military conflict blows up re Syria and with Turkey's issues with Iraq.
Oilers versus the Crude Oil Price
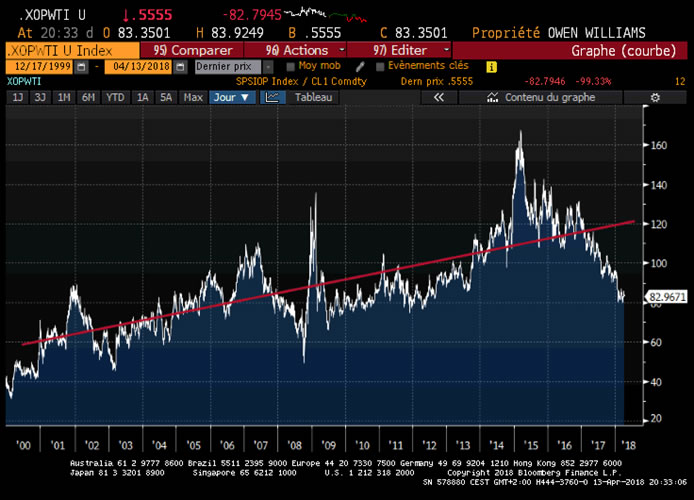
Investors in oil stocks since 2014 are undoubtedly aware of the lag in oil company price relative to the price of crude oil. This is another reason why we remain constructive on oil stocks. To quantify how much oilers are discounting the oil price, we plotted the ratio of the S&P Oil & Gas Exploration & Production Index to the WTI price from 2000. The curve rises over the long-term due to the fact that WTI is a non-yielding asset. The red line is our estimate of a least squares regression line through the curve. Based on this analysis, the S&P Oil & Gas Exploration & Production Index (XOP is the tracker), oil companies are -40% under-valued versus WTI prices.

Oil in Backwardation
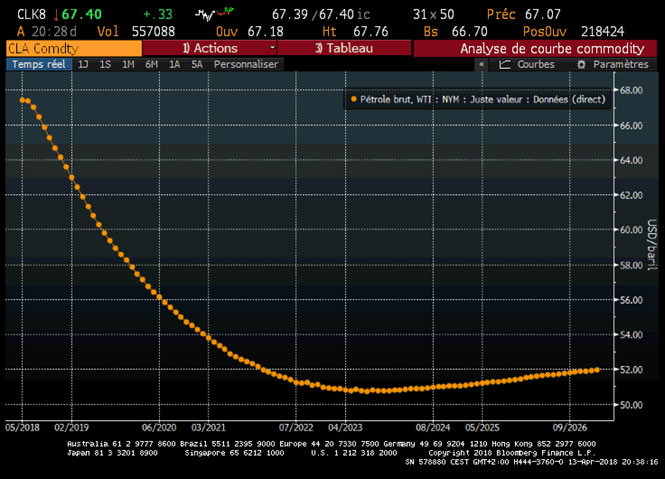
We note that the crude oil market is in backwardation. Currently the CME March 2019 WTI contracts are at $62.02 while NYMEX Spot is $67.01. The next chart shows the full futures curve for WTI. If the narrative was bullish, there would likely be contango. The market may be less pessimistic on the oil sector, but investors are far from optimistic.

Where Else Would A Long-Term Investor Go?
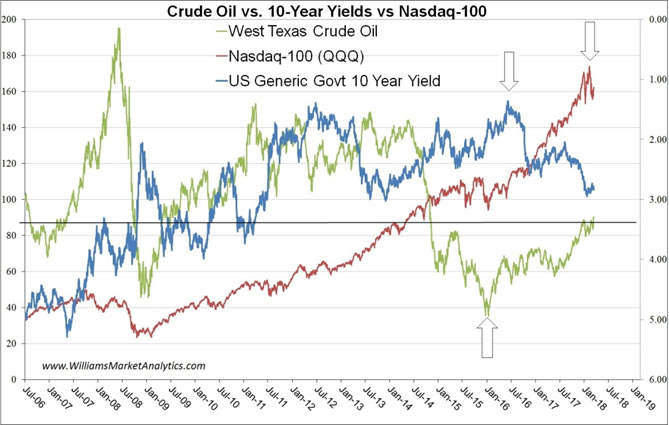
Our last chart this week shows the divergence between three major asset classes: the Nasdaq-100 (in red, which excludes oil and natural resource stocks), fixed income (in blue, with the interest rate scale inverted), and WTI (in green). Our arrows show our estimations of major trend inflection points on the three curves. We prefer being cautious on asset classes rolling over and being constructive on asset classes just turning up. The red star on the chart marks the date in mid-2017 when we began publishing positive article on oil prices (long before the market believed) and launched the Natural Resources fund.

Conclusion
WTI is breaking out. The narrative is turning in favor of oil prices but pessimism towards the resource sector still dominates in the market. The trend is now up, but will be choppy as the battle between oil bears and oil bulls is waged.
By Williams Market Analytics
http://www.williamsmarketanalytics.com
We provide insightful market analysis and account management founded upon our very successful systematic, disciplined approach to investing. Our investment analysis revolves around two inputs: company valuation and our quantitative, market-based indicators. Learn more about our approach and our strategist.
© 2018 Copyright Williams Market Analytics - All Rights Reserved
Disclaimer: The above is a matter of opinion provided for general information purposes only and is not intended as investment advice. Information and analysis above are derived from sources and utilising methods believed to be reliable, but we cannot accept responsibility for any losses you may incur as a result of this analysis. Individuals should consult with their personal financial advisors.
© 2005-2022 http://www.MarketOracle.co.uk - The Market Oracle is a FREE Daily Financial Markets Analysis & Forecasting online publication.


