


Crude Oil Price As Bullish as it Seems?
Commodities / Crude Oil Apr 17, 2018 - 12:35 PM GMTBy: Nadia_Simmons

A fresh 2018 high, an unbroken resistance and negative divergence. What does this interesting mix tell us about oil bull’s strength and further increases?
Technical Analysis of Crude Oil
Let's examine the charts below (charts courtesy of http://stockcharts.com).
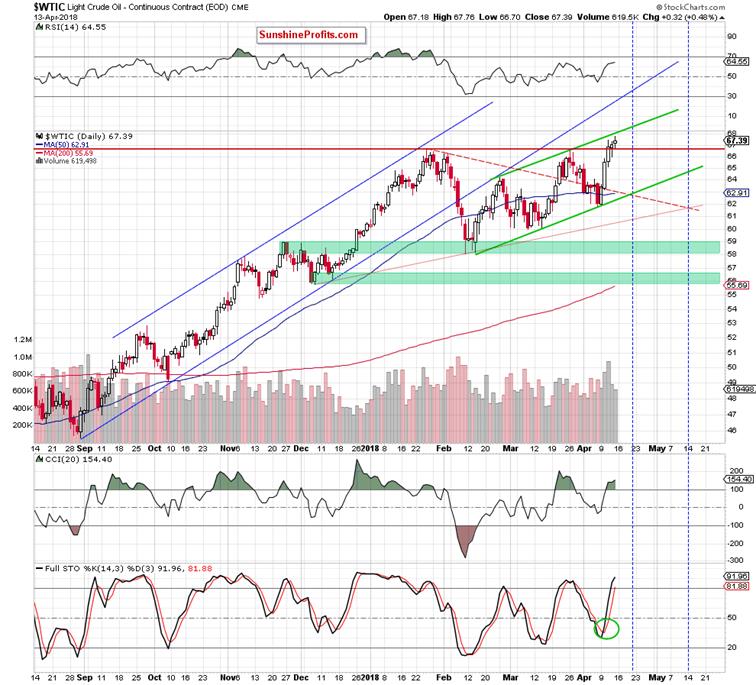
The first ting that catches the eye on the daily chart is a fresh 2018 peak created on Friday. Is this a positive sign? Yes. Is it bullish? In our opinion, not as bullish as it may seem at the first glance.
Why? Although black gold hit a new peak (only 21 cents higher than Wednesday’s intraday high), it is still trading under the upper border of the green rising trend channel.
Additionally, the shape of Friday’s candlestick doesn’t look encouraging (but only from the buyers’ point of view). For those who read our analysis for the first time, we would like to explain here what spool means for the trend. If this candlestick is drawn on the market, it means that the forces of the bulls and the bears have leveled out, and the market has lost strength for further increases (as in our case) or decreases.
However, the spool formation itself is not a strong prognostic formation. It should usually be confirmed by more candles. If the spool appears in the uptrend, the next black candle should appear to confirm the formation. Will we see it in the coming days?
Bearish Signs on the Horizon
Looking at the volume, such scenario seems very likely, because although light crude hit new high, Friday’s upswing materialized on the smallest volume in whole week, which doesn’t confirm oil bulls’ strength.
On top of that, the CCI and the Stochastic Oscillator climbed to their overbought areas, which suggests that we can see sell signals in the very near future. Additionally, there is also a bearish divergence between the price of black gold and the CCI, which increases the probability of reversal in the very near future.
Therefore, we still think that as long as the commodity remains inside the green channel oil bulls may have problems with further rally.
Potential Upside Targets
At this point, it is also worth noting that even if they manage to push black gold above this first resistance, the space for gains seems limited. Why?
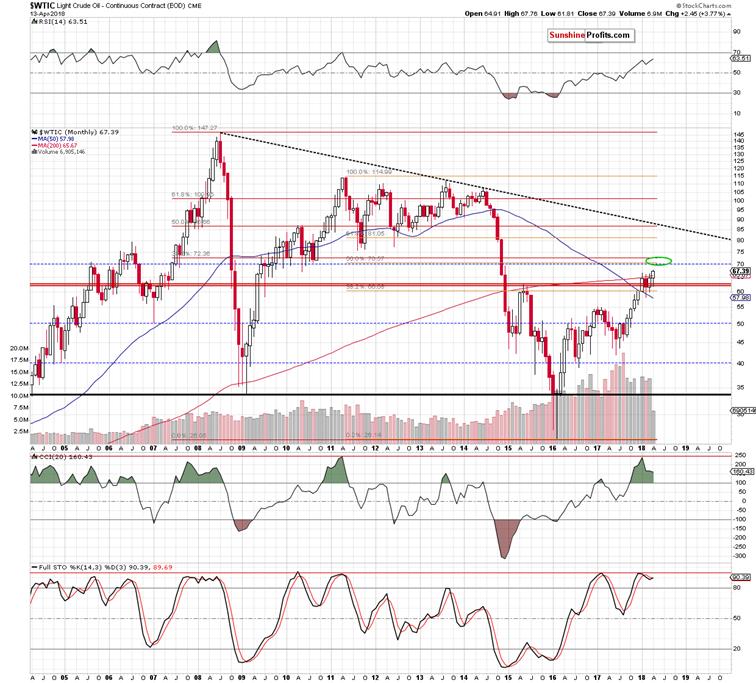
From the long-term perspective, we see that the nearest resistance zone is not far from yesterday’s closing price (around $70-$72.36) and is created by 3 important levels: the 38.2% Fibonacci retracement based on the entire 2008-2016 downward move, the 50% retracement based on the 2011-2016 downward move and the barrier of $70.
Elliott Waves Theory and Black Gold in April
This means that even if the price of black gold breaks through yesterday's peak, the pro-growth potential is not too big at this moment - especially when we factor in Elliott waves theory. What do we mean by that? Let’s take a look at the chart below.
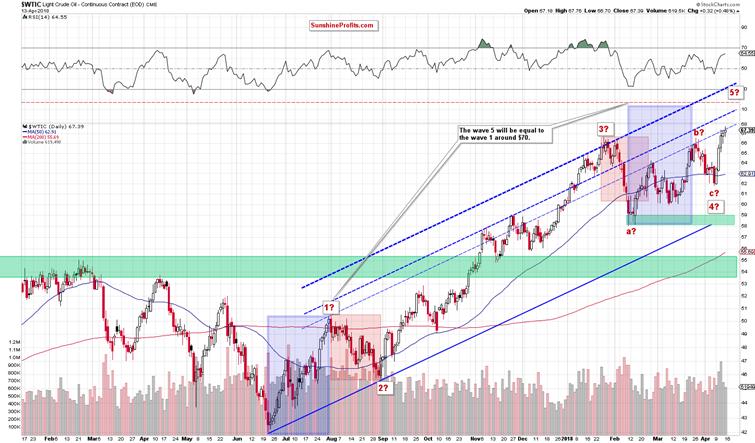
As you see on the above chart, a potential wave 5 will be equal to the wave 1 around $70, which increases the probability of reversal in this area (in other words, oil bears have one more reason to act in around the next strong resistance zone about which we wrote earlier). Therefore, we decided to wait at the sidelines for more bullish/bearish signals before we open next positions.
Finishing today’s Oil Trading Alert, we would like to point out that if we see another sign of oil bull's weakness (like an invalidation of the breakout above the January high, for example) we will consider opening short positions. We’ll keep our subscribers informed should anything change, or should we see a confirmation/invalidation of the above.
If you enjoyed the above analysis and would like to receive free follow-ups, we encourage you to sign up for our daily newsletter – it’s free and if you don’t like it, you can unsubscribe with just 2 clicks. If you sign up today, you’ll also get 7 days of free access to our premium daily Oil Trading Alerts as well as Gold & Silver Trading Alerts. Sign up now.
Nadia Simmons
Forex & Oil Trading Strategist
Przemyslaw Radomski
Founder, Editor-in-chief
Sunshine Profits: Gold & Silver, Forex, Bitcoin, Crude Oil & Stocks
Stay updated: sign up for our free mailing list today
* * * * *
Disclaimer
All essays, research and information found above represent analyses and opinions of Nadia Simmons and Sunshine Profits' associates only. As such, it may prove wrong and be a subject to change without notice. Opinions and analyses were based on data available to authors of respective essays at the time of writing. Although the information provided above is based on careful research and sources that are believed to be accurate, Nadia Simmons and his associates do not guarantee the accuracy or thoroughness of the data or information reported. The opinions published above are neither an offer nor a recommendation to purchase or sell any securities. Nadia Simmons is not a Registered Securities Advisor. By reading Nadia Simmons’ reports you fully agree that he will not be held responsible or liable for any decisions you make regarding any information provided in these reports. Investing, trading and speculation in any financial markets may involve high risk of loss. Nadia Simmons, Sunshine Profits' employees and affiliates as well as members of their families may have a short or long position in any securities, including those mentioned in any of the reports or essays, and may make additional purchases and/or sales of those securities without notice
Nadia Simmons Archive |
© 2005-2022 http://www.MarketOracle.co.uk - The Market Oracle is a FREE Daily Financial Markets Analysis & Forecasting online publication.