


US Stock Market Indexes Setup Bottom Confirmation Pattern
Stock-Markets / Articles May 07, 2018 - 10:25 AM GMTBy: Chris_Vermeulen

 On Wednesday, May 2, we issued a research post supporting our position that the markets were nearing an apex breakout and that critical support and resistance levels had established within the market. We indicated that volatility is usually quite high throughout these apex breakout moves with the potential for a “wash-out” price rotation in the works. In other words, as these apex breakouts happen, price can sometimes, falsely, break to one side or the other and rotate very quickly to the other side – creating what we call a “wash-out” price reversal.
Closing out this week, prices broke lower on Thursday, May 3, and reversed sharply before the end of the trading session to create a “wash-out” low formation which is indicative of a price bottom. We felt strongly that our ADL price modeling system’s analysis as well as this bottom formation are strong evidence that the US majors will enter a new upside price trend very quickly.
Last week we entered three trades to take advantage of this increased volatility, fear and large price swing in the markets with subscribers of our service. We took partial profits of 4% on one, the other is up over 7%, and the third is on the verge of a big move of 20% or more.
In this post we want to share with the markets general direction because there are some hot sectors and hot commodities like Crude Oil and Platinum that should have incredible moves over the next several weeks.
SP500 Channel, Washout Low & Breakout
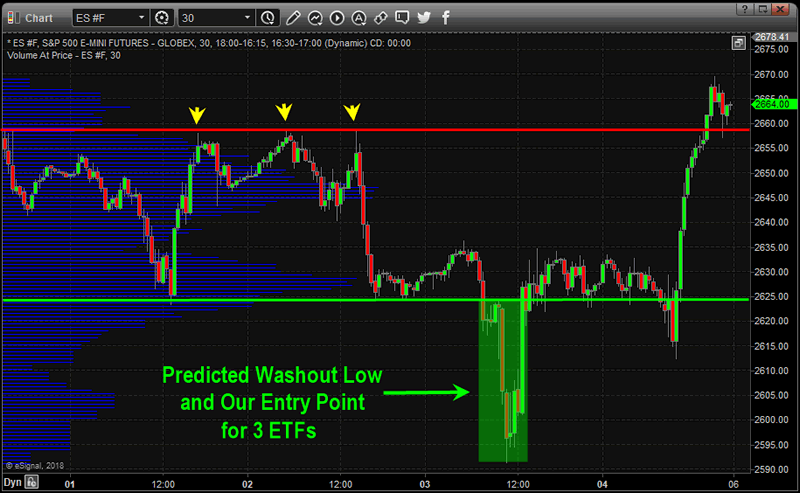
As of Wednesday, May 2, there were two levels we were watching: support at 2623 and resistance at 2658. The triple top formation in the ES was indicative of major resistance near 2658. We didn’t believe this range will hold for very long as our ADL price modeling system was predicting an upside price breakout.
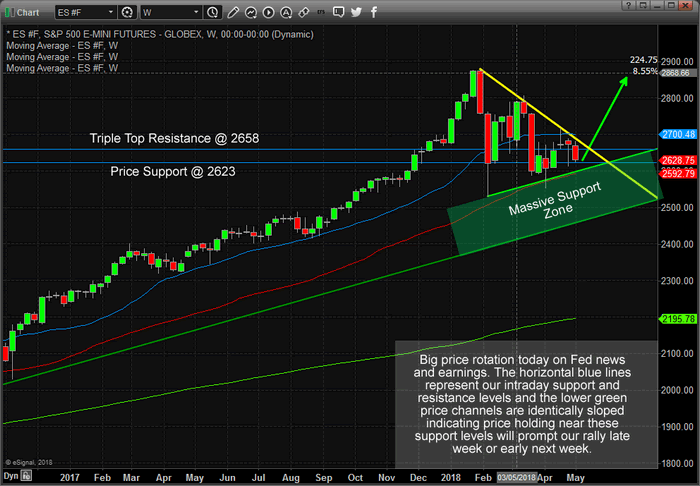
SP500 Pennant Formation
This ES Weekly chart clearly shows the pennant formation, lower price support channels and the two intermediate support and resistance levels drawn on the price chart, above. Our interpretation of the current market setup is that price may continue to rotate in somewhat violent modes until the breakout is completed. The breakout price move we are expecting could happen any minute between now and the end of next week. We believe this is the most likely time span for price to attempt this breakout move.
On Thursday, May 3, the markets created a moderately deep “wash-out low” pattern that we called in our Daily morning video to our members. We execute a few trades at bottom of this price rotation to take full advantage of this move.
Our previous research indicated the markets would attempt a rally within the next few weeks and we knew this price apex formation often includes volatility “wash-out” reversals near the end of the move. Our instincts proved very successful as the markets opened and rallied on Friday with a follow-through rally.
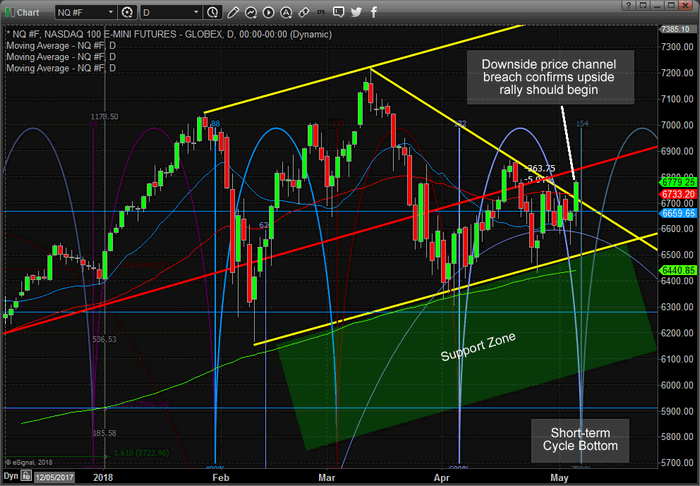
NASDAQ Pennant Formation
This, the NQ Daily chart, clearly shows the bullish price breakout that happened on Friday. This is the start of the “bottom confirmation” that we’ve been warning about for weeks. The next upside move to this formation should push NQ prices to well above 7000 and higher. Pay attention to how this move coincided with a Time/Price Cycle pattern indicating that we should have strong upside price movement over the next 5~10 trading days.
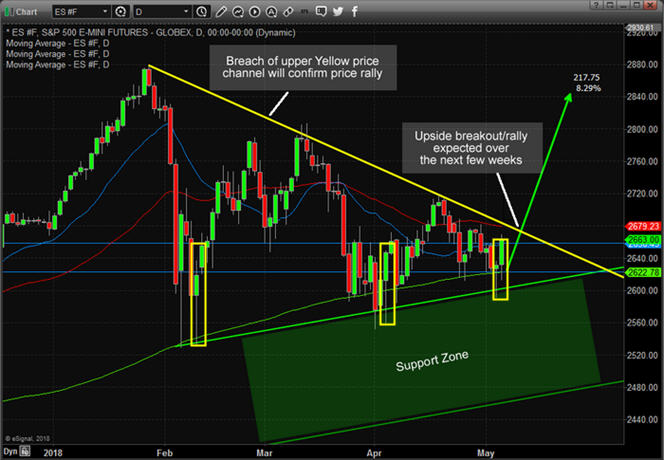
SP500 Pennant Formation Still Intact
This ES Daily chart shows that the S&P has not confirmed the price breach pattern just yet and will likely rally past this level early this week. This chart also shows the critical support and resistance levels that we had been watching over the past few days and provides a clear example of what a “wash-out” low looks like. Upside potential in the ES is clearly 7%+ over the next few weeks.
Our research team dedicated many hundreds of hours into digging into the underlying factors of the markets and developing advanced price modeling tools. Our Advanced Dynamic Learning price modeling systems and Adaptive Fibonacci price modeling systems are only available to our members.
If you have been following our analysis over the past few months, you know how valuable our research and timing tools are to creating success. We urge you to join our group of traders/members by subscribing today at www.TheTechnicalTraders.com to help support our continued efforts to create success for all our members. We continue to be 2~3 weeks (or more) ahead of the markets while almost everyone else is 2~3 weeks behind the markets. Which side do you want to be on?
CORE COMPETENCE
53 years experience in researching and trading makes analyzing the complex and ever-changing financial markets a natural process. We have a simple and highly effective way to provide our customers with the most convenient, accurate, and timely market forecasts available today. Our stock and ETF trading alerts are readily available through our exclusive membership service via email and SMS text. Our newsletter, Technical Trading Mastery book, and 3 Hour Trading Video Course are designed for both traders and investors. Also, some of our strategies have been fully automated for the ultimate trading experience.
Chris Vermeulen
www.TheTechnicalTraders.com
Chris Vermeulen has been involved in the markets since 1997 and is the founder of Technical Traders Ltd. He is an internationally recognized technical analyst, trader, and is the author of the book: 7 Steps to Win With Logic
Through years of research, trading and helping individual traders around the world. He learned that many traders have great trading ideas, but they lack one thing, they struggle to execute trades in a systematic way for consistent results. Chris helps educate traders with a three-hour video course that can change your trading results for the better.
His mission is to help his clients boost their trading performance while reducing market exposure and portfolio volatility.
He is a regular speaker on HoweStreet.com, and the FinancialSurvivorNetwork radio shows. Chris was also featured on the cover of AmalgaTrader Magazine, and contributes articles to several leading financial hubs like MarketOracle.co.uk
Disclaimer: Nothing in this report should be construed as a solicitation to buy or sell any securities mentioned. Technical Traders Ltd., its owners and the author of this report are not registered broker-dealers or financial advisors. Before investing in any securities, you should consult with your financial advisor and a registered broker-dealer. Never make an investment based solely on what you read in an online or printed report, including this report, especially if the investment involves a small, thinly-traded company that isn’t well known. Technical Traders Ltd. and the author of this report has been paid by Cardiff Energy Corp. In addition, the author owns shares of Cardiff Energy Corp. and would also benefit from volume and price appreciation of its stock. The information provided here within should not be construed as a financial analysis but rather as an advertisement. The author’s views and opinions regarding the companies featured in reports are his own views and are based on information that he has researched independently and has received, which the author assumes to be reliable. Technical Traders Ltd. and the author of this report do not guarantee the accuracy, completeness, or usefulness of any content of this report, nor its fitness for any particular purpose. Lastly, the author does not guarantee that any of the companies mentioned in the reports will perform as expected, and any comparisons made to other companies may not be valid or come into effect.
Chris Vermeulen Archive |
© 2005-2022 http://www.MarketOracle.co.uk - The Market Oracle is a FREE Daily Financial Markets Analysis & Forecasting online publication.