


Stock Market Study: Falling Initial Claims is Medium-long term Bullish for Stocks
Stock-Markets / Stock Markets 2018 May 09, 2018 - 12:18 PM GMTBy: Troy_Bombardia

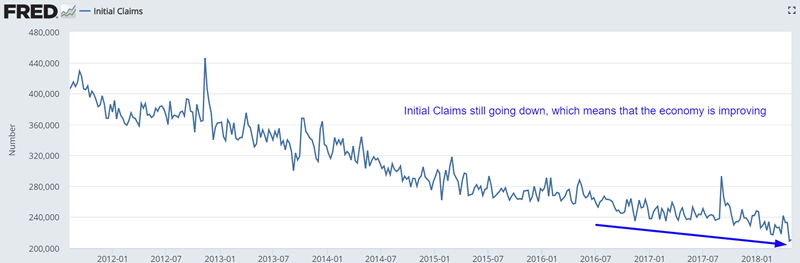
Initial Claims made a new low for this economic expansion in April 2018. This is a medium-long term bullish sign for the stock market. Initial Claims leads the economy, which leads the stock market.
Historically, economic recessions either led to bear markets in equities or “significant corrections”. The following chart shows how Initial Claims is a leading indicator for the stock market.
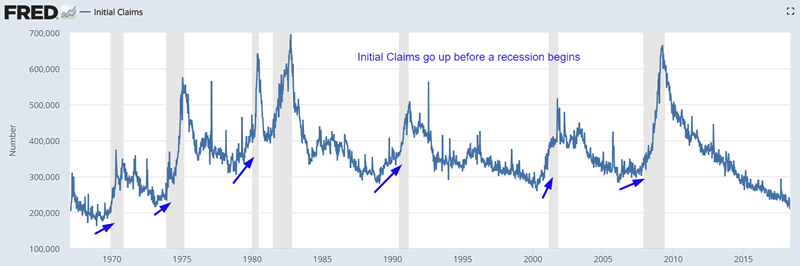
*Initial Claims always trended upwards before a recession began. But as stock market investors, we are more interested in how this data series leads the stock market.
Bear markets
The S&P 500 made 4 bear markets since 1950. These bear markets began on:
- October 12, 2007
- March 24, 2000
- January 12, 1973
- December 2, 1968
October 12, 2007
Initial Claims bottomed on January 28, 2006, more than 1.5 years before the bull market in stocks ended. The stock market and Initial Claims both trended higher during those 1.5 years.
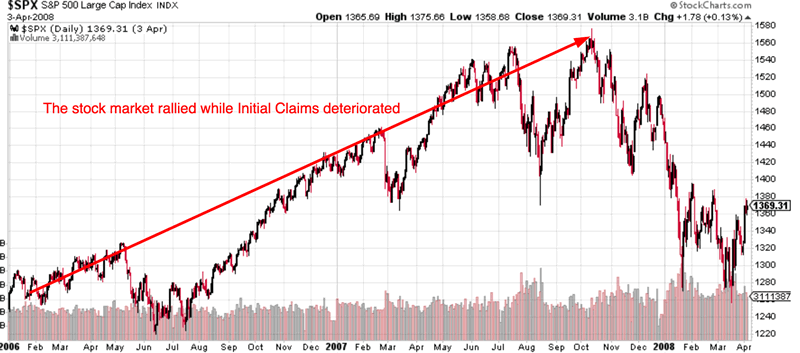
Initial Claims was a leading indicator for the stock market in this case.
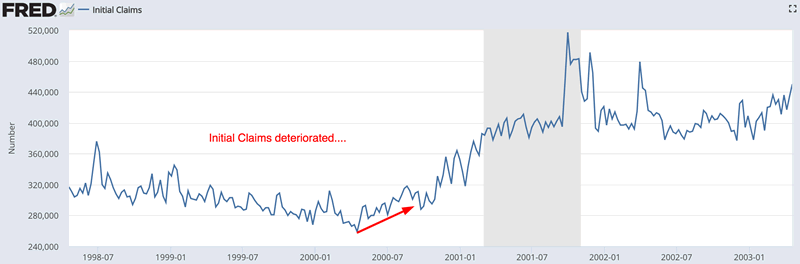
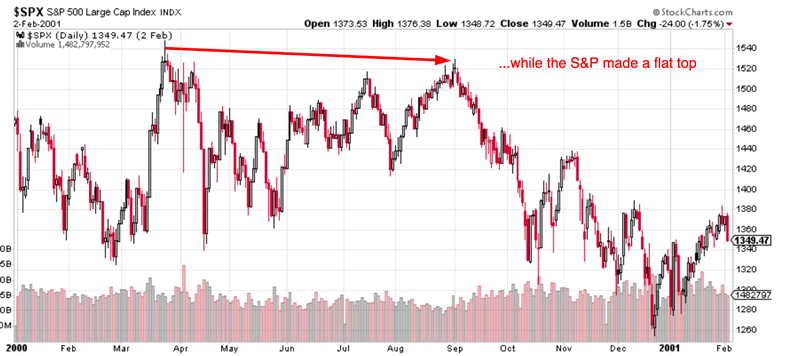
March 24, 2000
Initial Claims bottomed on April 15, 2000: 3 weeks AFTER the stock market peaked in this bull market cycle.
But here’s the key point: the S&P 500 almost made a double top on September 1, 2000 (it was 1.4% below its March 24 high). Hence we can use September 1 as the bull market’s high.
Initial Claims deteriorated and trended upwards from March 24 – September 1.
Initial Claims was a coincident indicator for the stock market in this case.
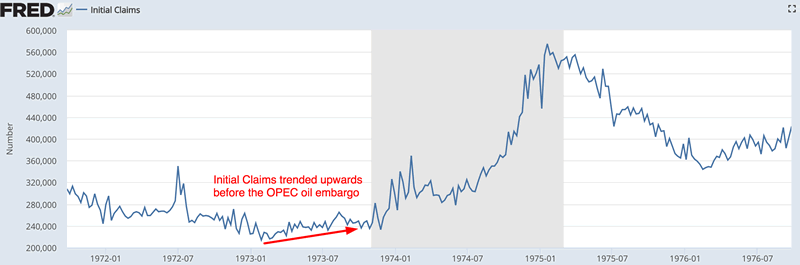
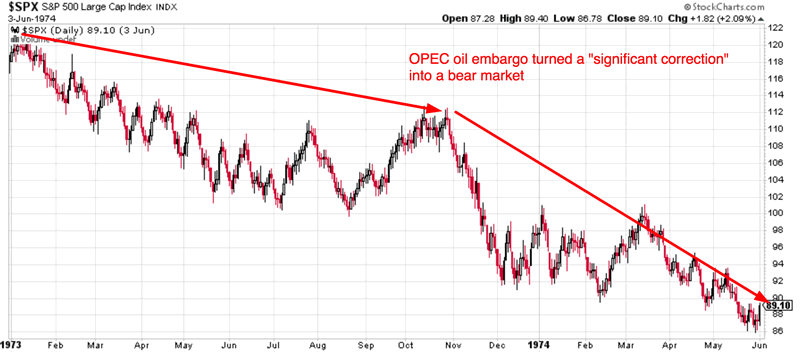
January 12, 1973
Initial Claims bottomed on January 27, 1973: 2 weeks after the stock market topped.
But here’s the key point: 1973 was not supposed to be a bear market. The Medium-Long Term Model initially predicted that this would be a “significant correction” (so we did get the SELL signal in 1972). But as more economic data came along, the model changed this “significant correction” prediction into a “bear market” prediction, which is precisely what happened.
Initial Claims was a coincident indicator for the stock market in this case.
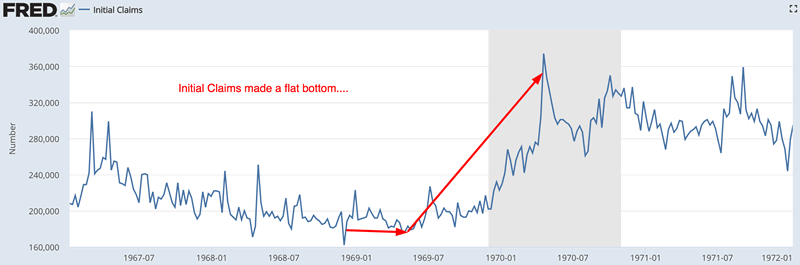
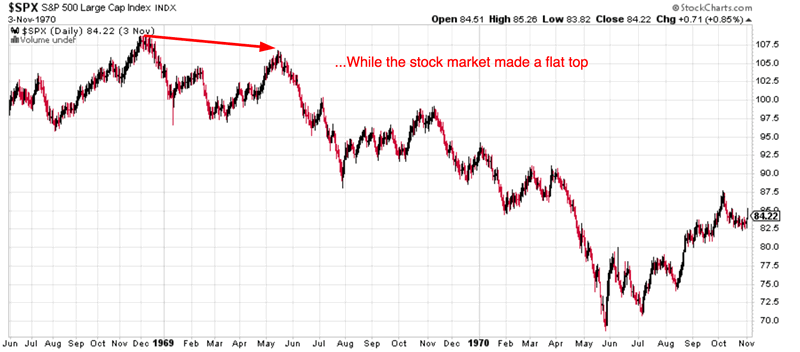
December 2, 1968
Initial Claims bottomed on November 30, 1968, a few days before the stock market topped.
The stock market made a flat top from from December 1968 – May 1969, while Initial Claims made a flat bottom. Then Initial Claims went up while the stock market fell after May 1969.
Initial Claims was a coincident indicator for the stock market in this case.
Significant corrections
Economic recessions lead to bear markets or “significant corrections”, but not all “significant corrections” are caused by economic recessions. We’re looking at the cases in which economic recessions (predicted by rising Initial Claims) led to “significant corrections” in the S&P 500.
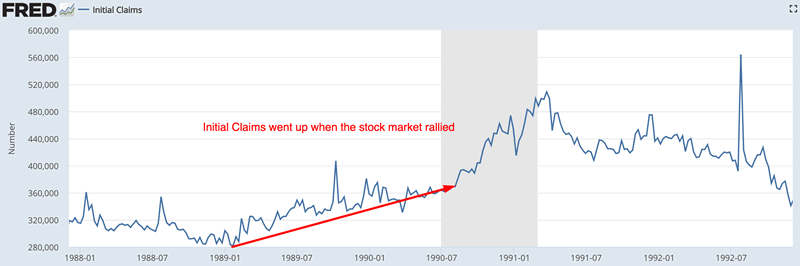
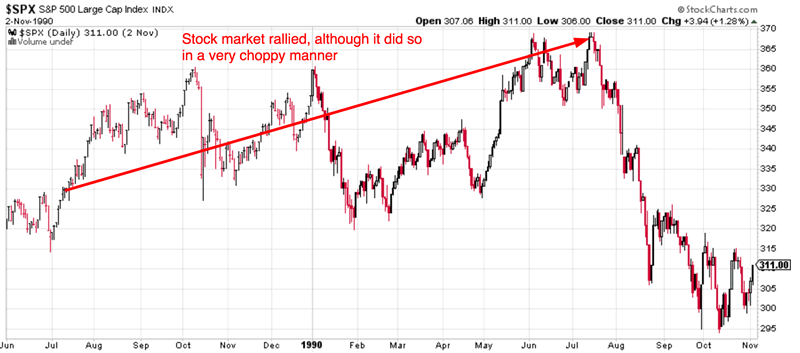
July 13, 1990
The stock market peaked on July 13, 1990. Initial Claims bottomed on January 21, 1989: 1.5 years before the stock market topped.
Initial Claims steadily trended higher while the stock market rallied from January 1989 to July 1990.
Initial Claims was a leading indicator for the stock market in this case.
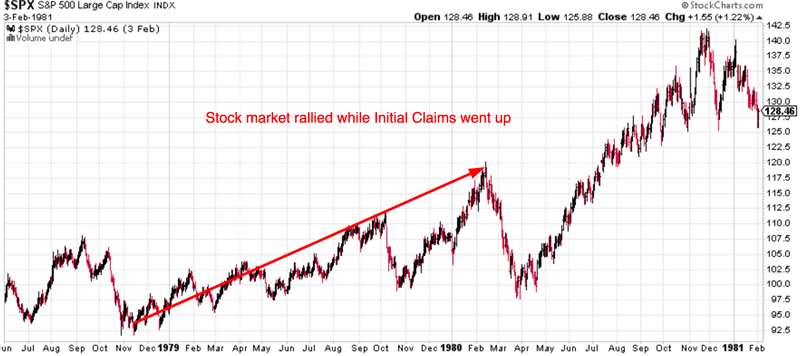
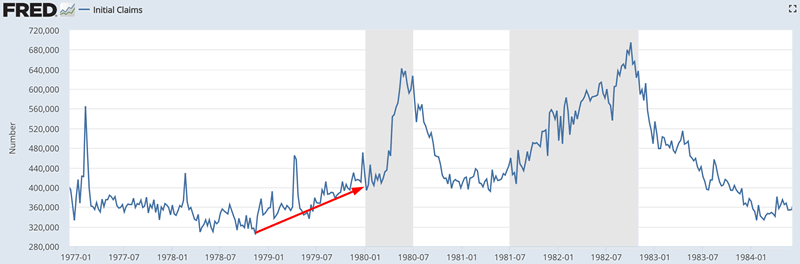
1980
1980 saw 2 “significant corrections” because the stock market made a double-dip recession.
Initial Claims bottomed on November 11, 1978. The stock market rallied while Initial Claims went up from November 1978 – February 1980. Initial Claims was a leading indicator for the stock market in this case.
Conclusion
Initial Claims is a slightly leading indicator for the stock market.
- Sometimes Initial Claims will flatten when the stock market makes a flat top. Initial Claims was a coincident indicator in these cases.
- Sometimes Initial Claims will rise when the stock market makes 1 final bull market rally. Initial Claims was a leading indicator in these cases.
Initial Claims was never really a lagging indicator for the stock market.
FALLING Initial Claims is a bullish sign for the stock market. It means that the equities bull market isn’t over. No bull market ended when Initial Claims was falling.
Read about the Golden/Death Cross Model with Initial Claims filter that yields an average of 16% per year.
By Troy Bombardia
I’m Troy Bombardia, the author behind BullMarkets.co. I used to run a hedge fund, but closed it due to a major health scare. I am now enjoying life and simply investing/trading my own account. I focus on long term performance and ignore short term performance.
Copyright 2018 © Troy Bombardia - All Rights Reserved
Disclaimer: The above is a matter of opinion provided for general information purposes only and is not intended as investment advice. Information and analysis above are derived from sources and utilising methods believed to be reliable, but we cannot accept responsibility for any losses you may incur as a result of this analysis. Individuals should consult with their personal financial advisors.
© 2005-2022 http://www.MarketOracle.co.uk - The Market Oracle is a FREE Daily Financial Markets Analysis & Forecasting online publication.