EUR USD Forex Analysis
Currencies / Euro May 27, 2018 - 06:13 PM GMTBy: Austin_Galt

 Latest Price – 116.61
Previous analysis updated – price has continued to trade down but the overall outlook calling for a substantial rally remains unchanged.
Weekly Chart

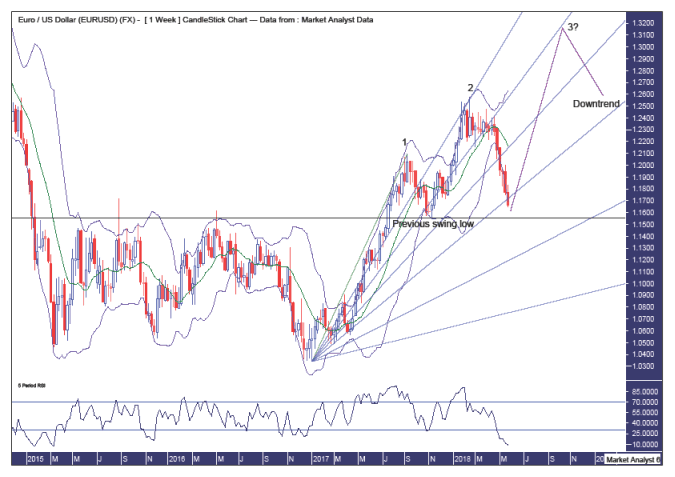
Pattern – while the move down off the high has been steep it has also done absolutely zero damage to the uptrend. Although price is now reaching the limit which is the previous swing low set in November 2017 at 1.1555 and is denoted by the horizontal line. I am looking for an explosive move higher that sets up a “three strikes and you’re out” top formation. This would be the final high with the first two strike highs already in place. While a 5 point broadening top has a possibility of developing I doubt that would happen and my line in the sand for this uptrend remains that 1.1555 level.
Bollinger Bands – price has hugged the lower band and there is still no sign of moving away, although I expect that to change imminently.
Fibonacci – the 50% angle was able to hold price which has subsequently traded further down and is now around support from the 61.8% angle. I am looking for support to kick in big time here. Confidence is high but the market will determine shortly whether or not that confidence is misplaced. I am looking for the final high to be up around resistance from the 38.2% angle later this year, most likely above the 1.30 level.
RSI – oversold.
Monthly Chart

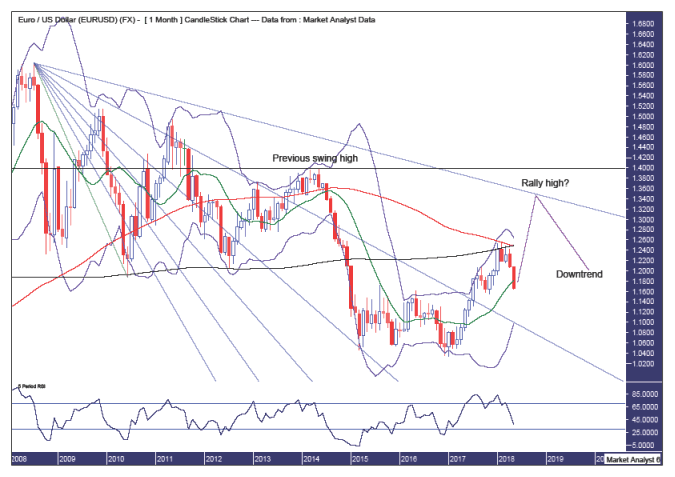
Pattern – a downtrend is in force and I am viewing this current uptrend as a bear rally only. Price trading above, or better said closing above, the previous swing high set in March 2014 at 1.3966 and denoted by the horizontal line would change that.
Bollinger Bands – price has traded down to the middle band and is currently marginally below. I favour support to come in here and send price back up to the upper band and beyond.
Fibonacci – the next major level of resistance is the 88.6% angle and that is where I am looking for this bear rally to ultimately top out at.
Moving averages – at the point of making a bearish crossover and this is the exact time where a reverse in direction takes place, at least temporarily.
RSI – in weak territory.
Summing up - while price has traded solidly lower over the last month, and may also nudge marginally lower this coming week, as long as price holds above the previous swing low of 1.1555 I remain solidly bullish over the coming months looking for an explosive rally in the vicinity of 15%.
By Austin Galt
Austin Galt has previously worked as a stockbroker and investment banker while studying technical analysis for over two decades. He is also the author of the book White Night: A Colombian Odyssey
Email - info@thevoodooanalyst.com
© 2018 Copyright The Voodoo Analyst - All Rights Reserved
Disclaimer: The above is a matter of opinion provided for general information purposes only and is not intended as investment advice. Information and analysis above are derived from sources and utilising methods believed to be reliable, but we cannot accept responsibility for any losses you may incur as a result of this analysis. Individuals should consult with their personal financial advisors.
Austin Galt Archive |
© 2005-2022 http://www.MarketOracle.co.uk - The Market Oracle is a FREE Daily Financial Markets Analysis & Forecasting online publication.


