


Topping USD’s Implications for Gold Investors
Commodities / Gold and Silver 2018 May 31, 2018 - 03:51 PM GMTBy: P_Radomski_CFA

 The euro plunged, the USD Index soared and gold… just stayed put. There was no meaningful action except for the big intraday volatility that ended in a rather small decline. Can one infer anything at all from the above combination of factors? Yes, if one knows where to look.
Let’s start by recalling what was the likely reason behind the recent strength in the precious metals in the first place and why did gold move (a bit) higher along with the USD Index.
First, there was a news-based factor in the form of the meeting between USA and North Korea that was cancelled and then the markets focused on the increased risks regarding the Eurozone, more precisely in Italy. We explained the details in yesterday’s analysis, but in short, just as Reuters wrote, Italy's fresh election risks being referendum on euro.
All in all, we have more of the same – yet another geopolitical factor that increases the price of gold in the very short term but is not likely to trigger any sustainable strength. Before negating the above, please note that Russia took Crimea from Ukraine in early 2014 and gold is lower than it was at that time even though many commentators called for an inevitable rally in gold prices. We explained that it didn’t have to happen and emphasized that the greatest pressure on the price of gold was when the uncertainty was at the highest levels. We didn’t have to wait long for the confirmation – the annexation became a fact, the tensions decreased, and gold declined. Just as this geopolitical event seems to be very bullish for gold, let’s keep in mind that its impact is very likely to be brief. As a reminder, in general, geopolitical events' impact on the price of gold is usually only temporary.
Technical factors, on the other hand, can, and are likely to result in major price moves as they represent shifts in investors’ sentiment, which can have lasting implications. Consequently, let’s take a look at the charts and check what’s in store for the next days and weeks.
Interestingly, the technical factors confirm what we wrote above – that the move higher in PMs was driven by geopolitical news and as such it’s likely to be temporary.
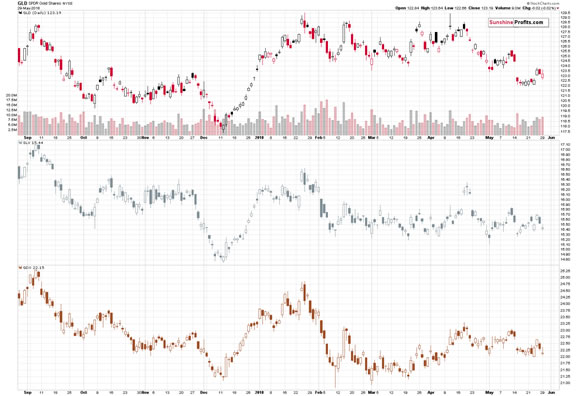
Gold is popularly viewed as the safe haven, while silver and mining stocks are generally not viewed as such. Taking the last few days into account, we see that overall nothing really happened in silver and miners, while gold moved higher. Precisely, they all moved higher, but only gold stayed relatively high.
The implication is that the most recent upswing in gold is not a game-changer, but a brief event that delays the real price move that’s about to happen either way. Naturally, if the World War III suddenly breaks out, or the financial system is destroyed, gold and silver will soar immediately, but that’s not likely to happen anytime soon. Besides, we have the insurance part of the gold portfolio to take care of such event.
Gold at its Resistance Line
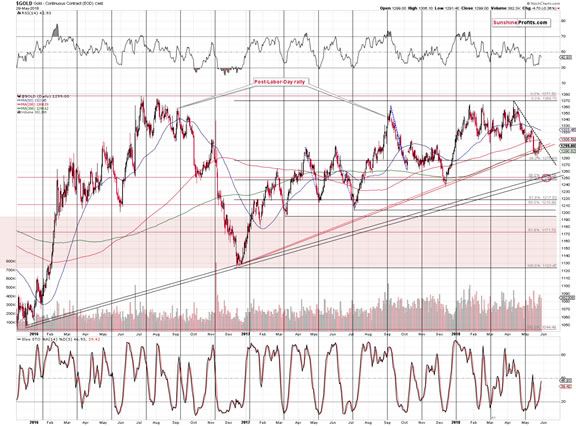
Looking at gold’s technical picture, we see no changes based on yesterday’s session. Gold remains below the declining resistance line and the downside target remains at about $1,250.
Earlier this month, gold rallied on volume that was the strongest (taking daily upswings into account) since the first half of April. This may have seemed bullish at the first sight, but please note that back then the big-volume session marked the final top that preceded an almost $100 downswing. The strength of the resistance that was reached back then was bigger as it was based on more and more long-term tops, but the current resistance line is not weak either. Therefore, we may have just seen the final top this time as well. After all, the history tends to repeat itself to a certain extent.
Silver’s Upcoming Reversal
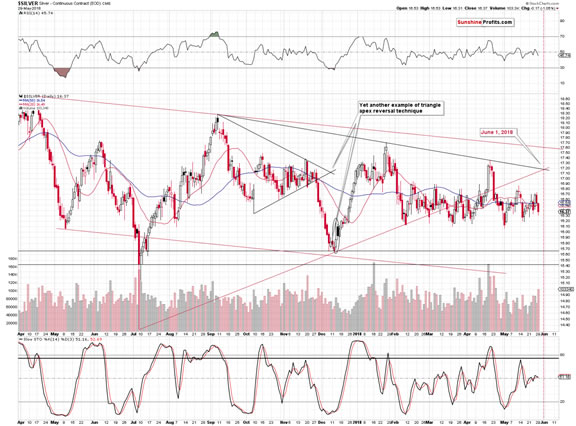
Silver’s back and forth movement around the $16.50 level continues. We could see some action shortly based on the apex-based turning point. Precisely, we’re likely to see some kind of reversal on June the 1st (Friday) or very close to it. Will that be a bottom or a top? Before this week, it was very likely that it will be a bottom after a bigger decline. However, since PMs moved higher on geopolitical events, it could be the case that they will stay afloat for a few more days and decline in early June.
On the other hand, silver just declined on volume that was biggest this month, which seems to confirm the bearish outlook for the near term. Overall, it currently seems best to focus on a bigger move instead of trying to time the daily ones.
We know it’s tiring to watch the markets move back and forth, but knowing that periods of very low volatility often precede the greatest volatility makes the waiting and paying attention to the seemingly boring market worth it.
Before moving to mining stocks, we would like to briefly discuss the issue of silver’s underperformance of gold. Since silver is known to outperform right at the top (or at least before declines), then perhaps one should view silver’s daily underperformance as something opposite and bullish?
We don’t think so. This kind of performance is indeed seen from time to time, but the reliability of silver’s relative performance as predictive tool is much higher when it comes to timing tops than it is to timing bottoms.
Besides, silver’s underperformance is perfectly understandable given the situation in the silver to gold ratio.
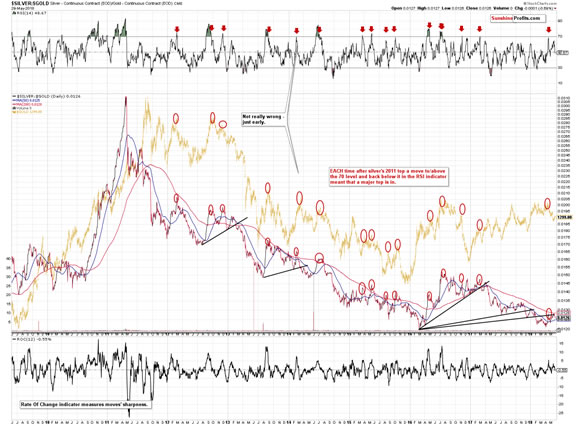
The ratio recently moved back to the rising support / resistance line and now it’s moving back down. Technically, it was simply a second verification of the breakdown. Silver’s underperformance here is therefore something to be expected. It is, therefore, not a bullish sign, but rather a normal course of action.
Mining Stocks’ Turning Point
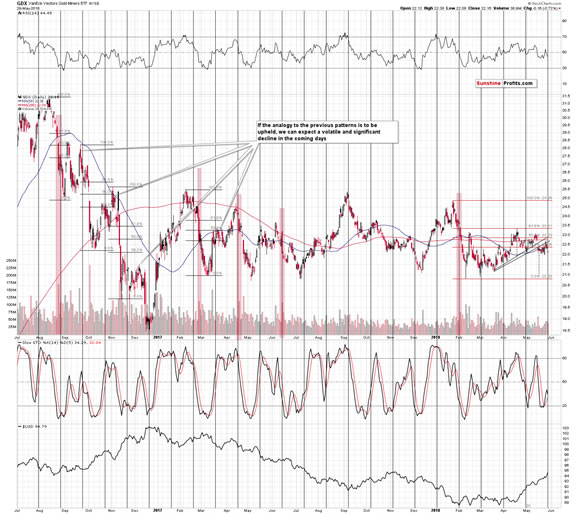
The volume on which GDX declined last Friday was higher than the one on which it had rallied last Thursday, which means that the overall implications of that session were bearish. The true move appears to be down and the correction was to the upside. Yesterday’s session definitely confirms it, as miners declined to the previous May lows even though gold is still close to its last week’s highs.
The cyclical turning point in the mining stocks took place yesterday, which means that the most recent short-term upswing had bearish implications, so seeing weakness in the miners was likely yesterday. Please note that yesterday was the first session, after which the US investors had the chance to react to the news from Italy, and we could have seen some temporary strength. In yesterday’s alert we explained that it didn’t have to be anything major and it’s likely to be temporary. In fact, we wrote that the reaction could be nothing more than just an intraday move.
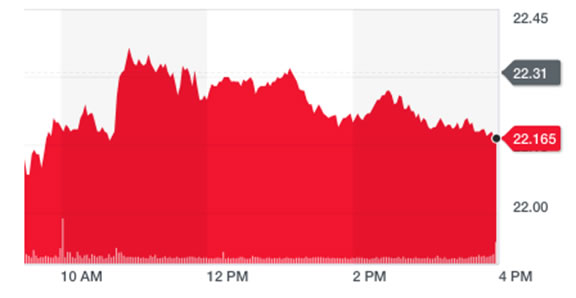
The above is the intraday GDX price chart from finance.yahoo.com. GDX opened the session below the previous day’s open, moved higher on an intraday basis and then the strength faded away. The reaction was weak and the implications are bearish.
Let’s go back to the price of gold. This time we’ll look at it in terms of the euro.
Gold’s Overbought Status
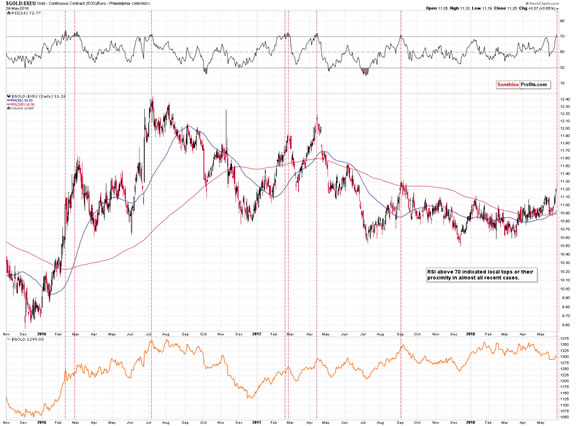
The RSI indicator does a very good job at detecting overbought and oversold levels for some assets and gold is one of them. The above applies also when one views gold from the European perspective.
The RSI based on the gold’s price in terms of the euro just moved visibly above the 70 level and the previous 2018 high. Gold’s rally may seem encouraging to European gold bulls, but it actually means that it’s high time for gold to turn south.
We marked similar situations with red vertical lines. As you can see, this signal accompanied local tops in gold many times in the past. It was not necessarily very precise, but it was almost always followed by a tradable decline.
The additional bearish confirmations come from the gold to the S&P 500 ratio.
Gold vs. S&P 500
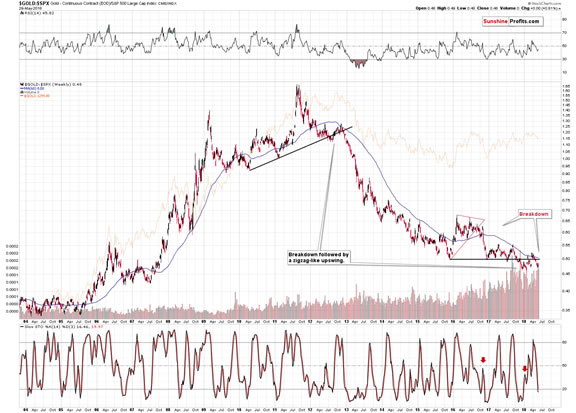
First of all, the price of gold and its ratio with the general stock market tend to move together in case of the key medium-term moves. More importantly, the ratio can lead the price of gold, and thus an important development in it could indicate that something similar is about to take place in gold.
That was the case in late 2012, when the ratio was the first to break below the medium-term support line and start a big downswing. Gold joined the decline later on and that was THE decline of the decade. Of course, the decade is not over yet and what we’re about to see this year could take this title from the 2012-2013 move.
The thing is that we are seeing this pattern once again. What’s remarkable is that the breakdown below the current support line is very similar to what we saw in the late 2012. Gold first broke below the support line, then moved back above it, then below it again and then up once again, above the previous high. Then the final breakdown followed. This is what we saw in 2012 and what we’ve been seeing for the past 6 months or so. The implications of this analogy are very bearish for the following months.
But the USD!
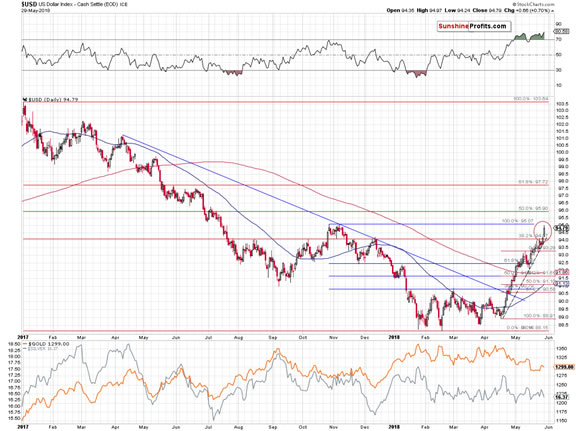
The USD Index moved to 94.97, which is practically right at the upper border of our trading area, which means that it could correct now. This should be a bullish trigger for the precious metals market. But will it really be one?
Let’s discuss the recent dynamics in the gold-USD link.
The most recent strength in the USD Index wasn’t accompanied by gold’s decline, but by a move higher. Gold rallied more visibly in comparison to other currencies, especially in comparison to the euro. This may make you wonder if one should view this as a sign of strength in the yellow metal. Indeed, it would have been the case, if gold was moving higher despite the strength of the US currency. But, it wasn’t essentially the strength of the US currency, but the weakness of other currencies (especially the euro) that caused the USD Index to move higher.
The USD Index is a weighted average of several currency exchange rates, the biggest of which is the EUR/USD. Obviously, there are two sides of the currency exchange rate and it can move because something changed regarding either one currency, or the other, or regarding both of them. In this case, it was not US economy’s strength that pushed USDX higher – it was EU-trouble.
Why does the above matter to us - precious metals’ investors?
Because we check the gold-USD link in order to check if gold is showing adequate strength or not. If it doesn’t, it means that it’s likely to change direction. The key word here is “adequate”. We want to compare gold’s performance to factors that should generate a certain response and they don’t. For instance, a major decline in the value of the US currency in light of growing unemployment should cause gold to rally. If it doesn’t, it means that gold doesn’t really want to move higher at this time and one might consider shorting it.
But, if there are problems in one the Eurozone’s biggest economies, then shouldn’t gold actually move higher as a risk hedge? Shouldn’t the USD rally as a risk hedge as well as being world’s key currency and it’s clear that some investors will prefer to move out of the euro in the light of increased risks surrounding it? Indeed, that’s what should take place and that’s what we saw: gold moved higher along with the USD Index, but the size of both moves was not significant.
Can we really speak of gold’s strength in the light of the above? No. It moved just like it should, and its reaction actually could have been much bigger. Therefore, we don’t think that there are bullish implications of the recent action in the gold-USD link.
Now, let’s discuss what’s happening today and what’s likely to happen in the following days.
If it was the increased risk regarding the Eurozone that actually caused both: gold’s rally and USD’s rally, then subsiding risk could be negative for both: USD and gold. Consequently, while the USD Index is currently likely to move lower, it may not translate into much higher prices of precious metals and mining stocks. In fact, the USD index is down by 0.68 today and gold is basically flat ($2 higher), not responding to what should be a bullish factor.
Naturally, there will be immediate-term moves (like an hourly rally or so) that cause gold to move higher when the USD declines, but over time it could be the case that gold doesn’t really rally. For instance, we could have a situation, in which gold moves higher by $4 when USD declines by 0.4, but then a move $7 lower in gold while the USD goes back up by 0.2. If you repeat this several times, you’ll get lower gold and USD prices even though on an immediate-term basis it will seem like gold is responding to USD’s moves.
Summary
Summing up, while the USD Index may be forming a short-term top, gold and silver don’t have to respond by rallying significantly and since the most recent precious metals strength seems to be geopolitical-news-driven, any strength that we had already seen is likely to be only temporary. The technical picture for the precious metals’ market didn’t change and it remains bearish as we outlined in detail in the previous alerts.
If you’d like to receive follow-ups to the above analysis, we invite you to sign up to our gold newsletter. You’ll receive our articles for free and if you don’t like them, you can unsubscribe in just a few seconds. Sign me up!
Thank you.
Przemyslaw Radomski, CFA
Founder, Editor-in-chief
Tools for Effective Gold & Silver Investments - SunshineProfits.com
Tools für Effektives Gold- und Silber-Investment - SunshineProfits.DE
* * * * *
About Sunshine Profits
Sunshine Profits enables anyone to forecast market changes with a level of accuracy that was once only available to closed-door institutions. It provides free trial access to its best investment tools (including lists of best gold stocks and best silver stocks), proprietary gold & silver indicators, buy & sell signals, weekly newsletter, and more. Seeing is believing.
Disclaimer
All essays, research and information found above represent analyses and opinions of Przemyslaw Radomski, CFA and Sunshine Profits' associates only. As such, it may prove wrong and be a subject to change without notice. Opinions and analyses were based on data available to authors of respective essays at the time of writing. Although the information provided above is based on careful research and sources that are believed to be accurate, Przemyslaw Radomski, CFA and his associates do not guarantee the accuracy or thoroughness of the data or information reported. The opinions published above are neither an offer nor a recommendation to purchase or sell any securities. Mr. Radomski is not a Registered Securities Advisor. By reading Przemyslaw Radomski's, CFA reports you fully agree that he will not be held responsible or liable for any decisions you make regarding any information provided in these reports. Investing, trading and speculation in any financial markets may involve high risk of loss. Przemyslaw Radomski, CFA, Sunshine Profits' employees and affiliates as well as members of their families may have a short or long position in any securities, including those mentioned in any of the reports or essays, and may make additional purchases and/or sales of those securities without notice.
Przemyslaw Radomski Archive |
© 2005-2022 http://www.MarketOracle.co.uk - The Market Oracle is a FREE Daily Financial Markets Analysis & Forecasting online publication.