


Back to Resistance for Bitcoin and Ethereum
Currencies / Bitcoin Jul 04, 2018 - 03:23 PM GMTBy: Submissions

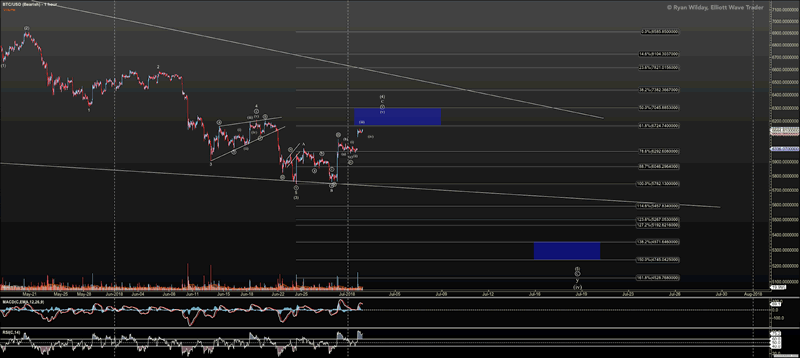
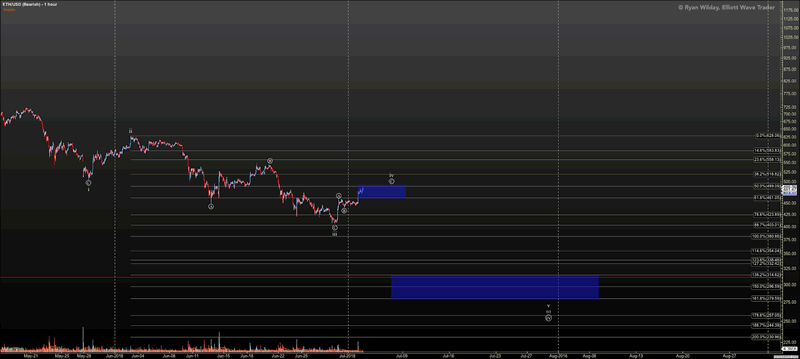
By Ryan Wilday: In last week’s article, my charts showed that I expected a corrective rally into the zones we are now pushing against. As always, I marked key resistance with a box and price has entered those areas. These zones are $6724-$7045 in bitcoin (BTC-USD) and $461-$489 in ethereum (ETH-USD).
Because I don’t view the downside trend as complete, nor do we have price through resistance in, my primary remains that that we’ll see further downside. But any thesis regarding market direction must be held loosely. Instead this is an opportunity for me to observe how the market reacts.
By the time this article hits the press, we should know whether a larger trend change is upon us.
The first warning we’ll get is a push over resistance. If that push is very strong, then we know. But sometimes markets push ever so slightly over resistance, then instead of reacting downward, they pull back correctively and push through strong on the second try.
In either of these situations I will avoid the short side of the trade for the time being.
We can also watch support below us for sign of a decline.
For bitcoin, a break of $6123 and more so $5990 will have me increase the short side of the trade. In ethereum, a break of $436 with follower through below $425 is indication that the slide has renewed.
To remind you regarding what I said last week, breaking these levels above us do not necessarily confirm the correction that started in January has ended. We could see a high c of a high B wave rally that ultimately ends lower. But it could be a very tradeable rally regardless.
Yet even if that B wave rally commences, it can turn into something larger, so we’ll move support up if it commences to see whether we should stay in the long trade longer.
In short, we have hit another key moment in the crypto market that I’m watching closely.
I’ve been primary short in my short-term accounts since May 28 and that has proved profitable. Yet, we’ve seen bearish sentiment intensify. The chart I shared last week showing how short interest has climbed has continued to run higher into this week.
And, with the market again pushing up against resistance, I have to hold loosely to the bearish case.
Ryan Wilday is a cryptocurrency analyst at ElliottWaveTrader, where he hosts the Cryptocurrency Trading premium subscription service.
© 2018 Copyright Ryan Wilday - All Rights Reserved Disclaimer: The above is a matter of opinion provided for general information purposes only and is not intended as investment advice. Information and analysis above are derived from sources and utilising methods believed to be reliable, but we cannot accept responsibility for any losses you may incur as a result of this analysis. Individuals should consult with their personal financial advisors
© 2005-2022 http://www.MarketOracle.co.uk - The Market Oracle is a FREE Daily Financial Markets Analysis & Forecasting online publication.